Skip to content
Real Cost Report
  • Legal
    • DUI & Criminal Defense
    • Employment Law
    • Family Law & Divorce
    • Mass Tort
    • Personal Injury
  • Insurance
    • Auto Insurance
    • Health Insurance
    • Home Insurance
    • Life Insurance
  • Mortgage
    • Buying Home
    • Mortgage Process
    • Mortgage Rates
    • Refinancing
  • Loans
    • Personal Loans
    • Student Loans
    • Auto & Secured
    • Credit Scores & Debt
  • Investing
    • Brokerage & Tools
    • Investing Strategy
    • Retirement Planning
    • Taxes & Wealth
  • Healthcare
    • Long-Term Care
    • Medical Costs
    • Medicare
    • Mental Health
  • Business
    • Business Insurance
    • Finances
    • Growth & Operations
    • LLC & Legal Structure
    • Payroll, Accounting & Tax
  • Estate Planning
    • Costs
    • Digital & Modern Estate
    • Power of Attorney
    • Probate & Inheritance
    • Wills & Trusts
Real Cost Report
Real Cost Report
  • Legal
    • DUI & Criminal Defense
    • Employment Law
    • Family Law & Divorce
    • Mass Tort
    • Personal Injury
  • Insurance
    • Auto Insurance
    • Health Insurance
    • Home Insurance
    • Life Insurance
  • Mortgage
    • Buying Home
    • Mortgage Process
    • Mortgage Rates
    • Refinancing
  • Loans
    • Personal Loans
    • Student Loans
    • Auto & Secured
    • Credit Scores & Debt
  • Investing
    • Brokerage & Tools
    • Investing Strategy
    • Retirement Planning
    • Taxes & Wealth
  • Healthcare
    • Long-Term Care
    • Medical Costs
    • Medicare
    • Mental Health
  • Business
    • Business Insurance
    • Finances
    • Growth & Operations
    • LLC & Legal Structure
    • Payroll, Accounting & Tax
  • Estate Planning
    • Costs
    • Digital & Modern Estate
    • Power of Attorney
    • Probate & Inheritance
    • Wills & Trusts

Life Insurance

Real life insurance costs by age, health status, and policy type. Term vs whole life premium data and underwriting factors in 2026.
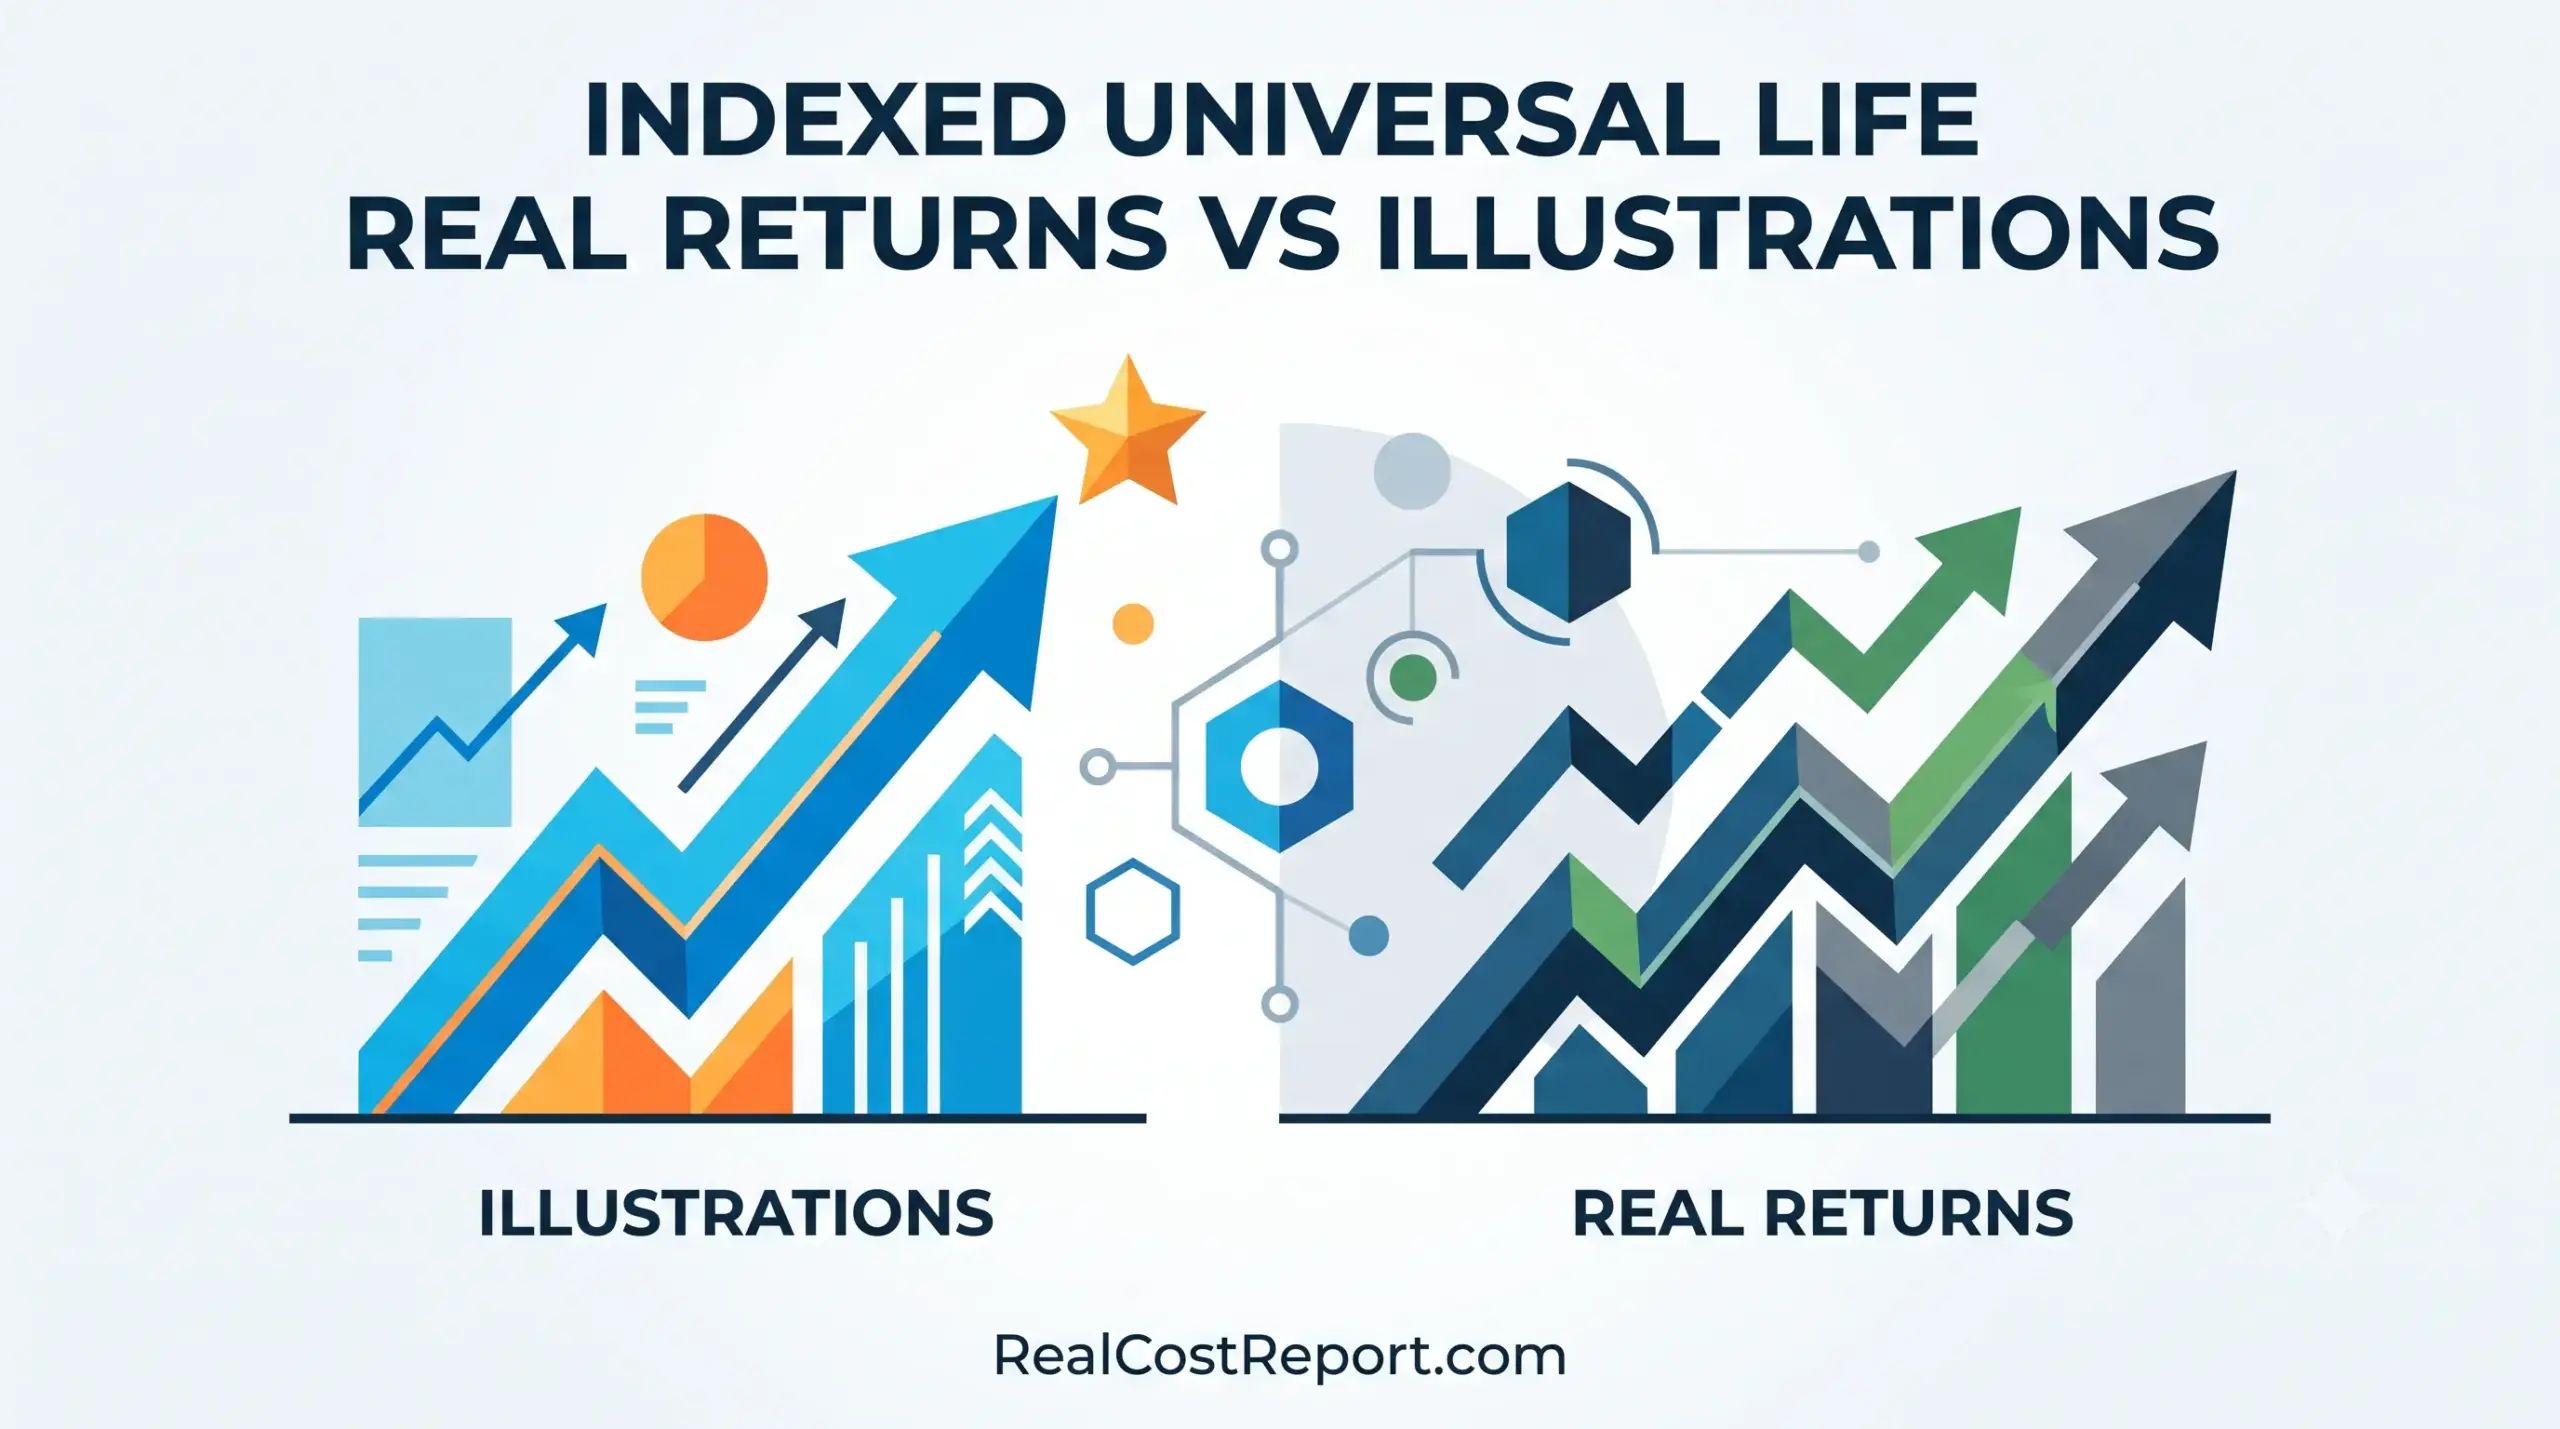

An editorial vector graphic illustrating the comparison between life insurance illustrations and actual real returns.

Indexed Universal Life Real Returns vs Illustrations: What IUL Actually Delivers in 2026

Geometric illustration of a figure with a heart symbol standing safely behind a protective shield and umbrella.

Life Insurance for High-Risk Applicants 2026: What Health Conditions Really Cost

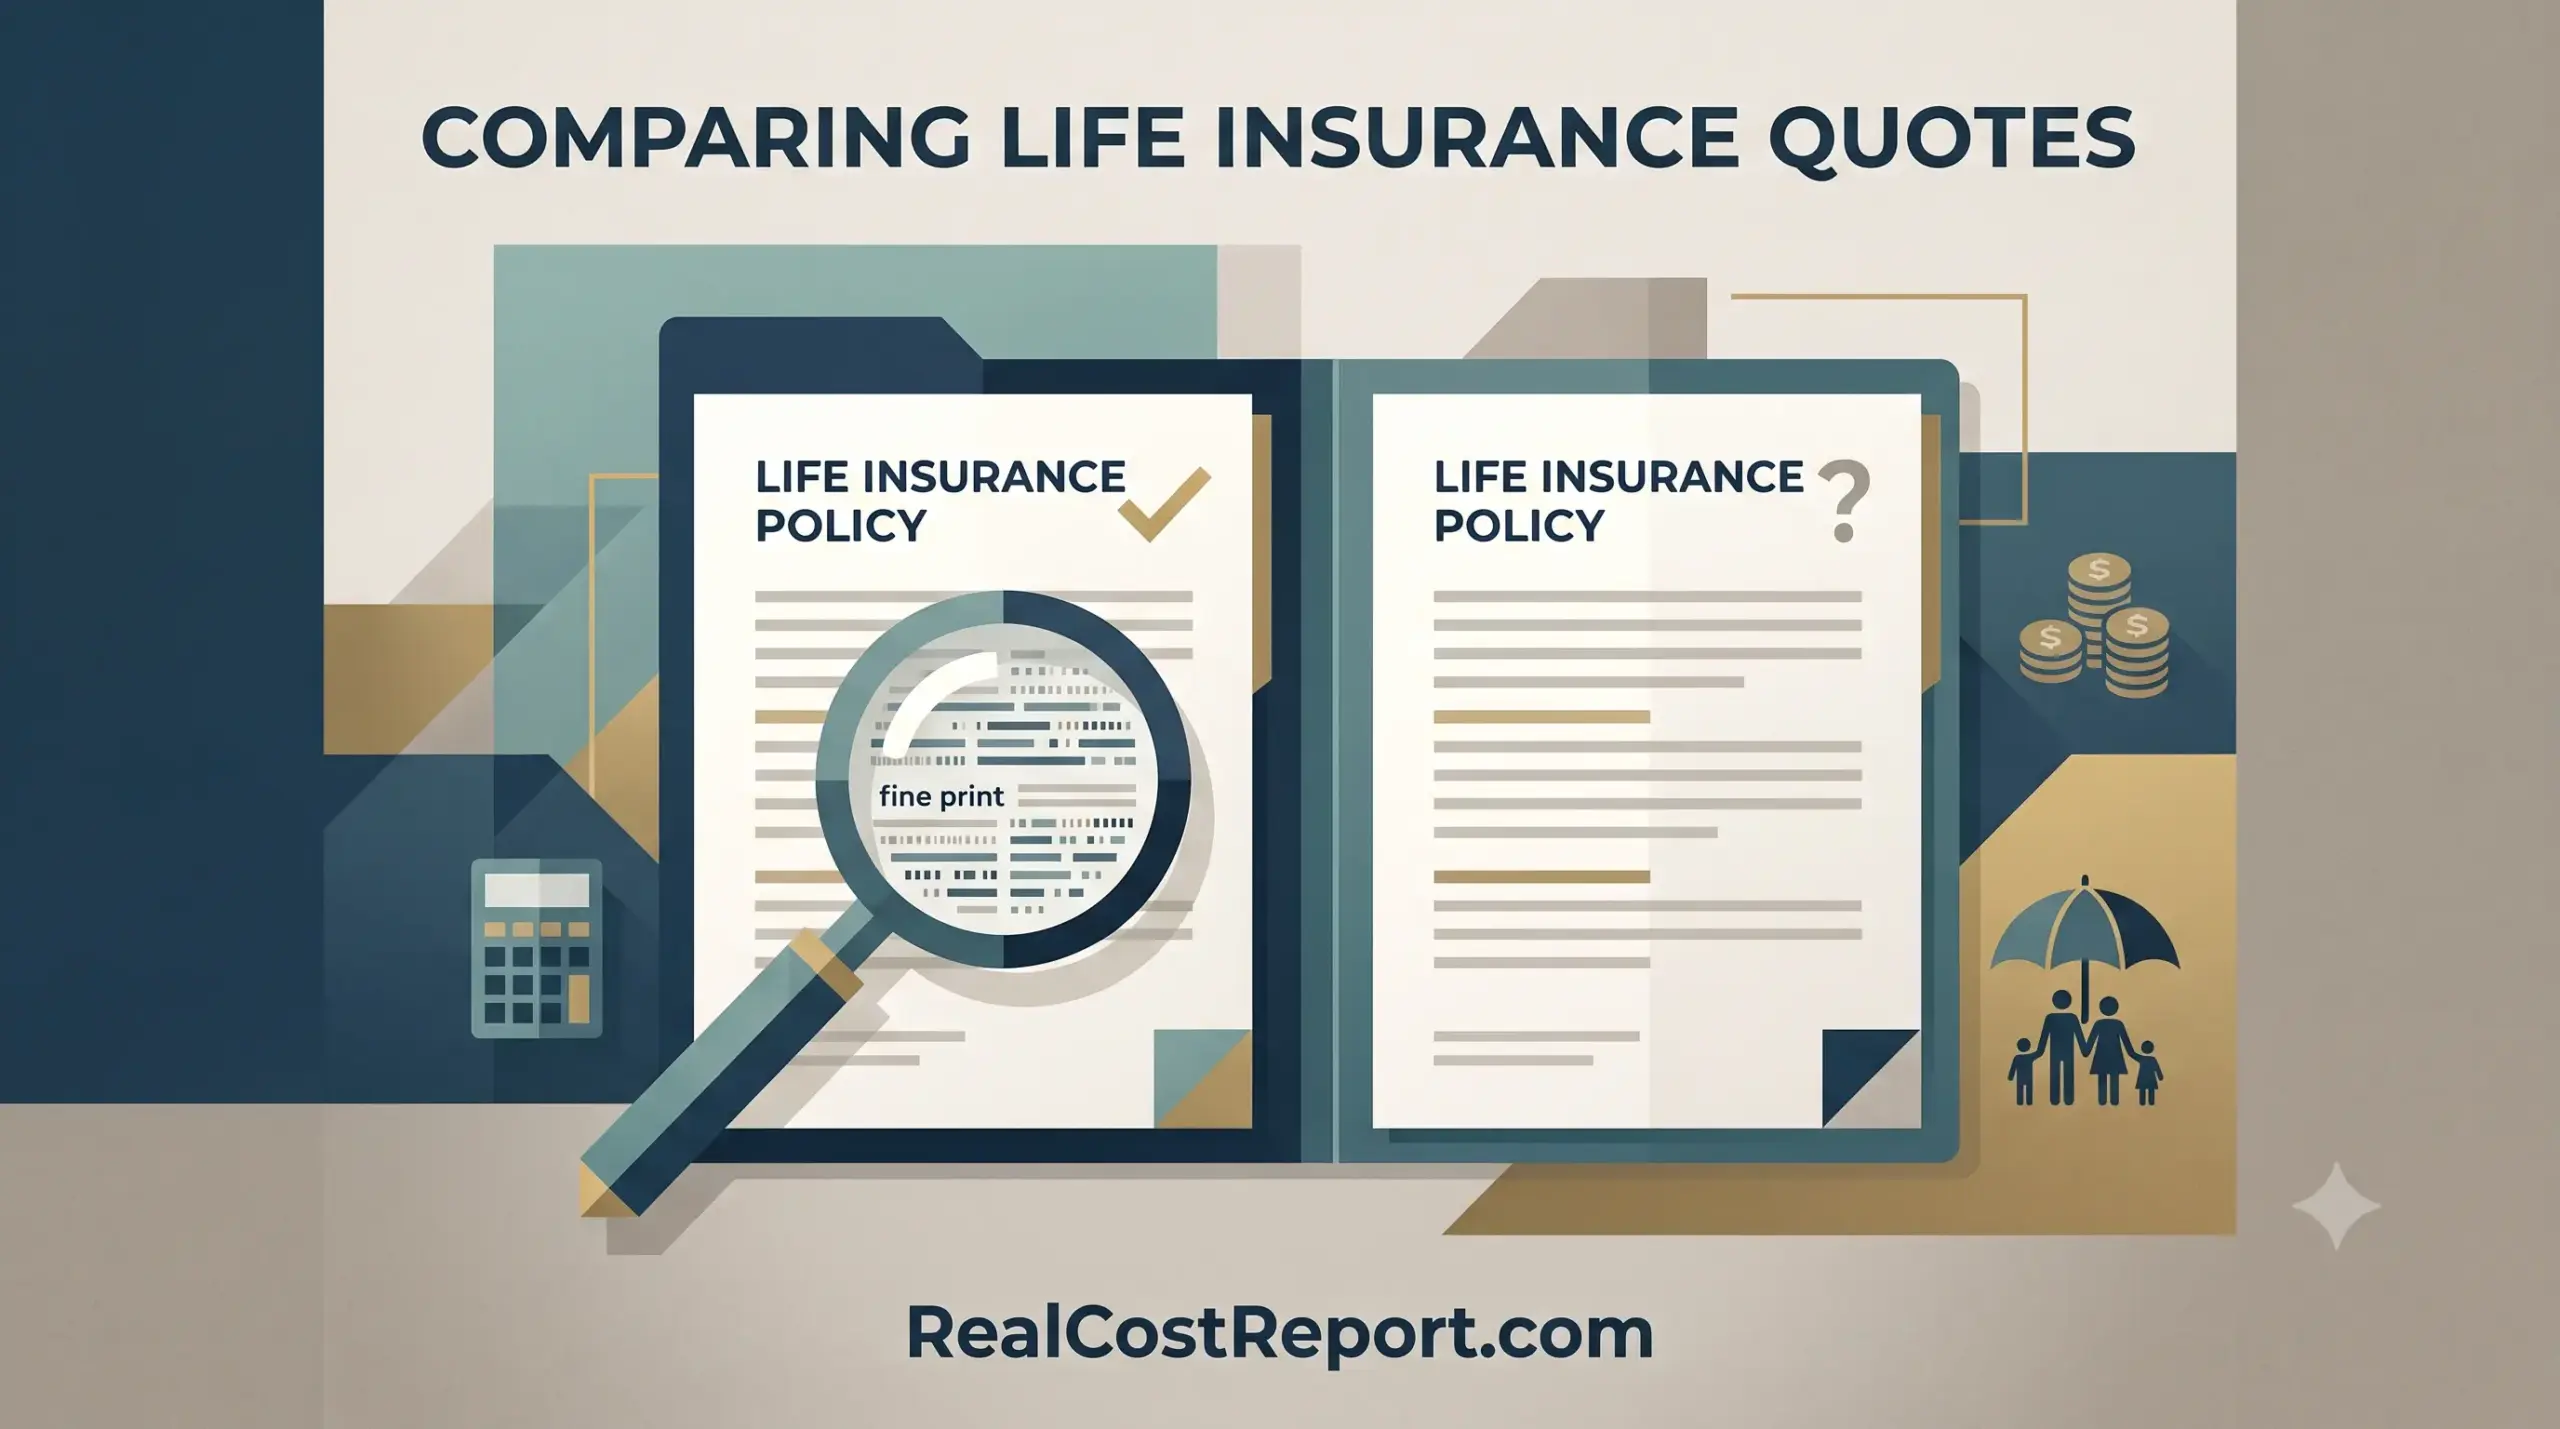
A stylized vector illustration showing a magnifying glass over two competing life insurance policy documents for comparison.

How Much Life Insurance Really Costs in 2026: Comparing Quotes and Reading the Fine Print

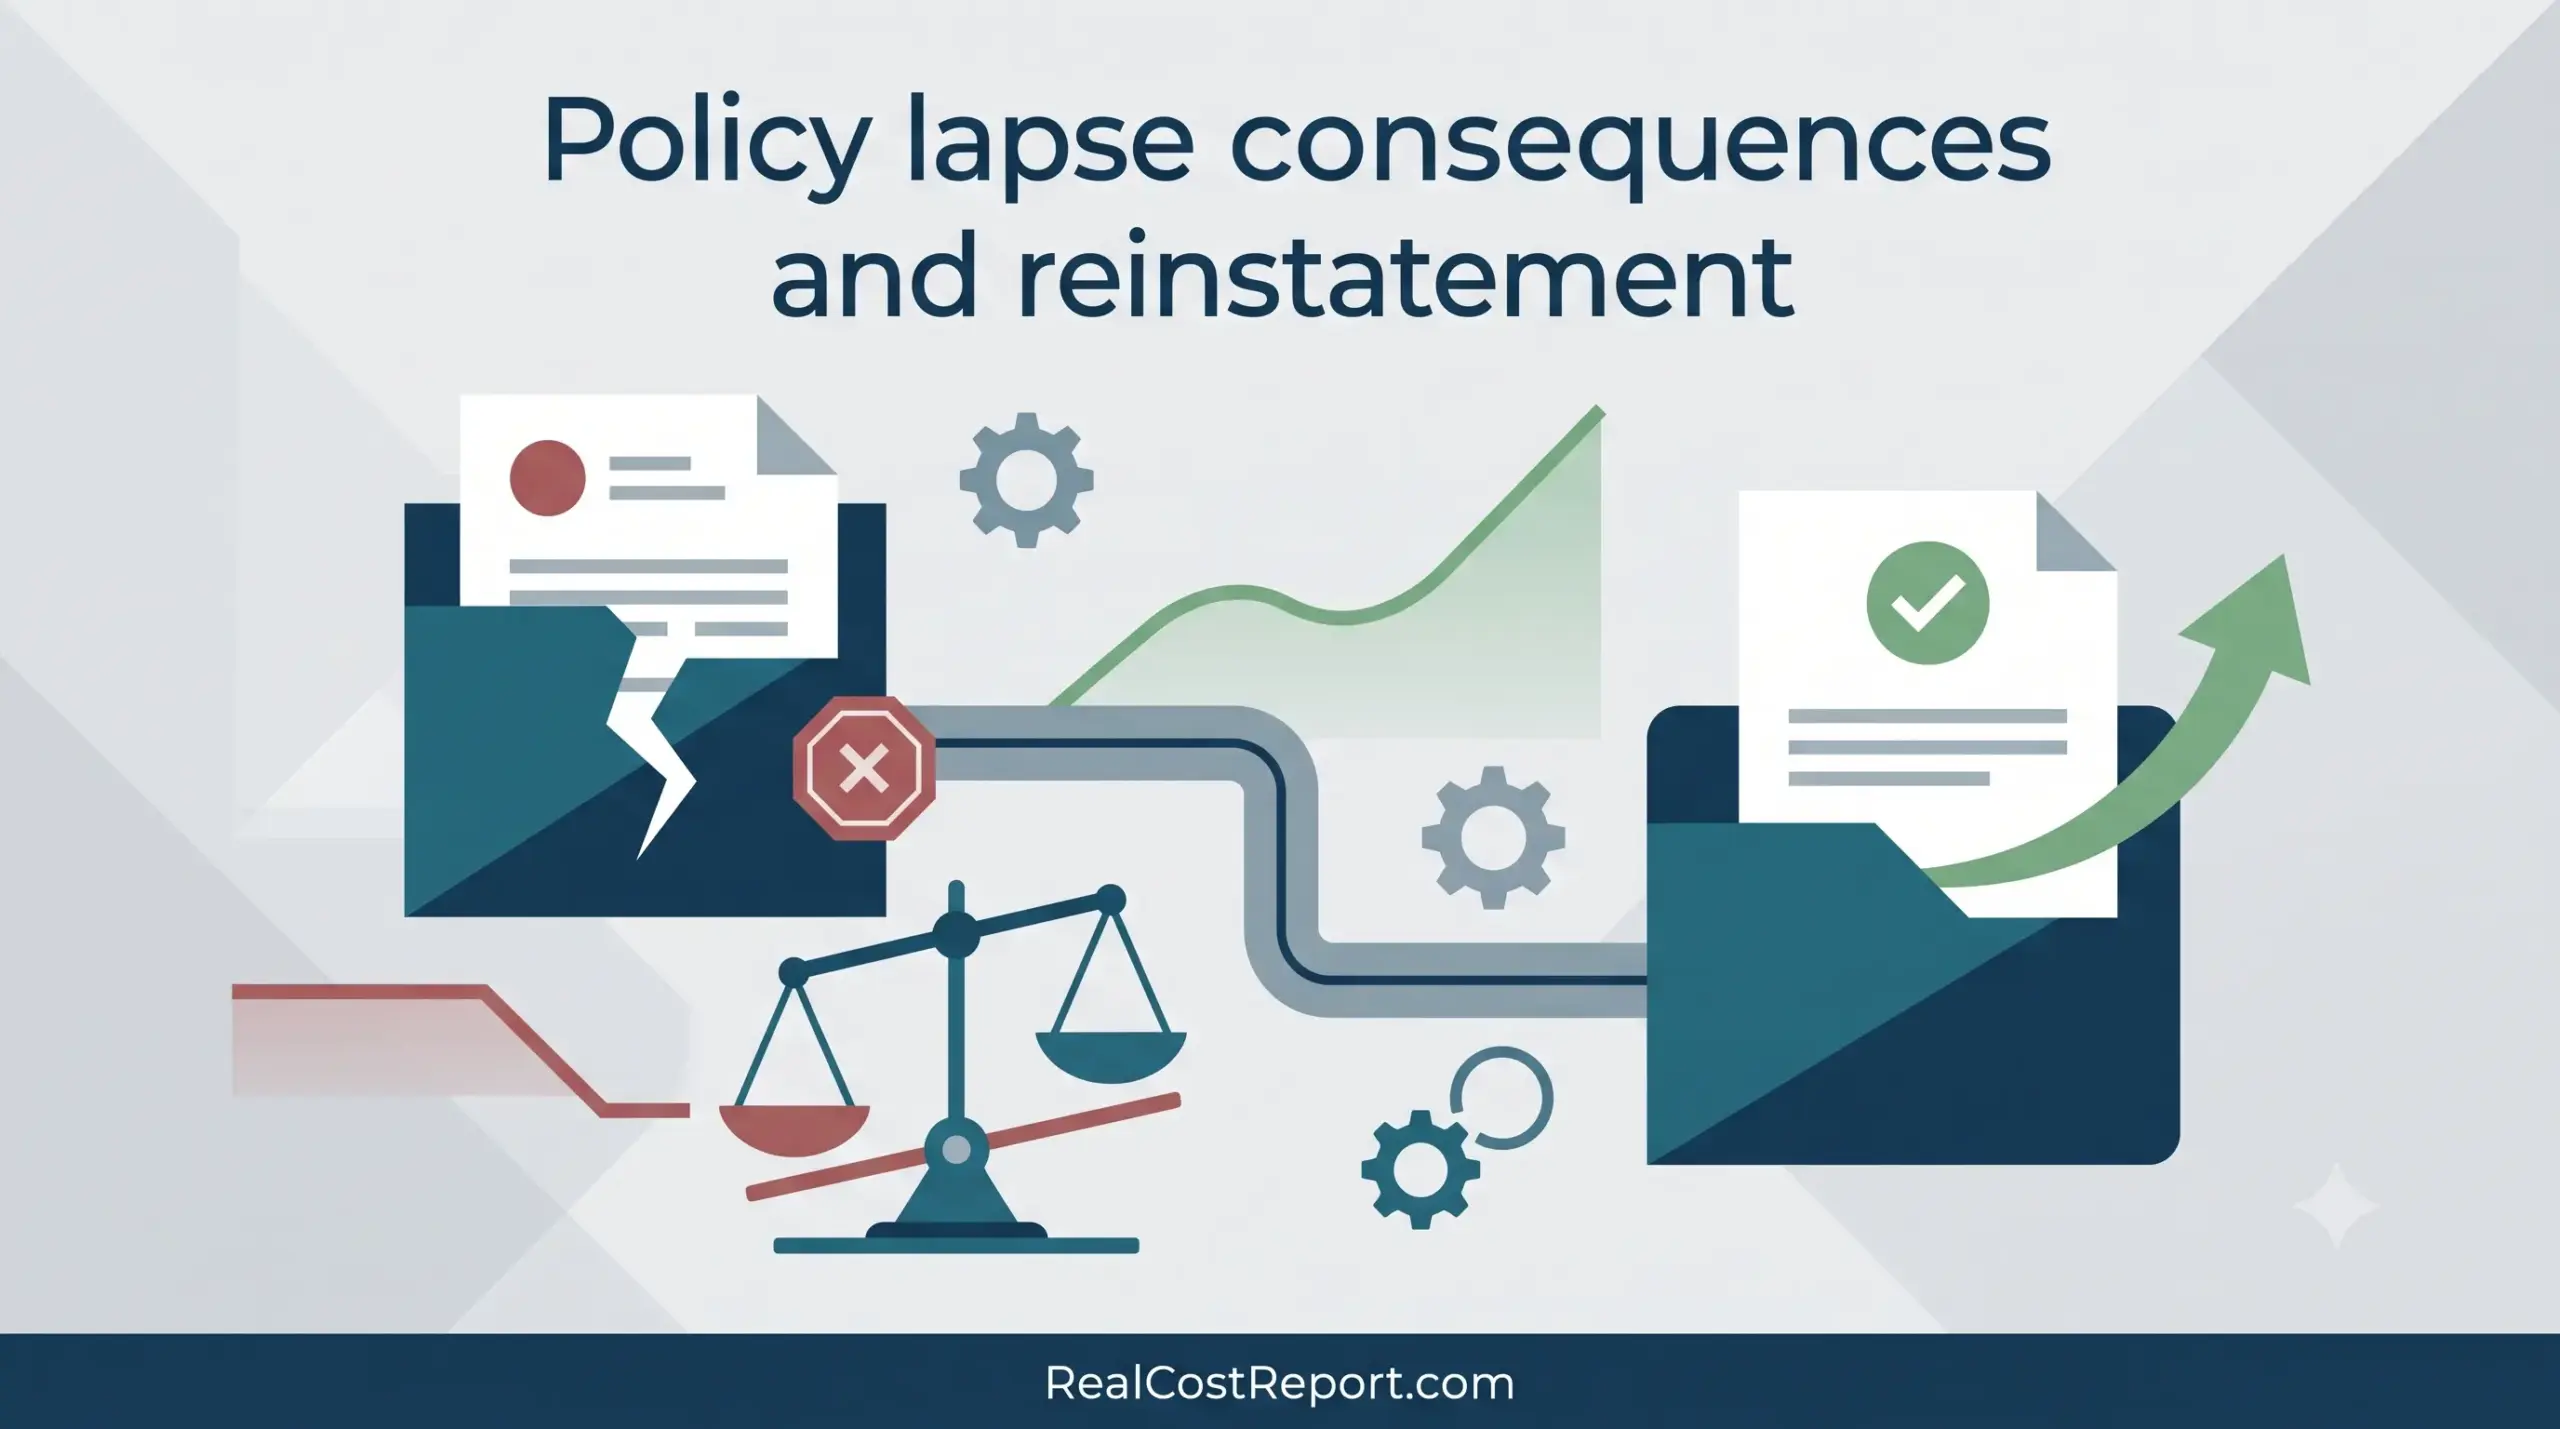
A geometric illustration for RealCostReport.com shows a broken policy document being restored with a green arrow and checkmark.

Life Insurance Policy Lapse: Reinstatement Cost and Consequences (2026 Guide)

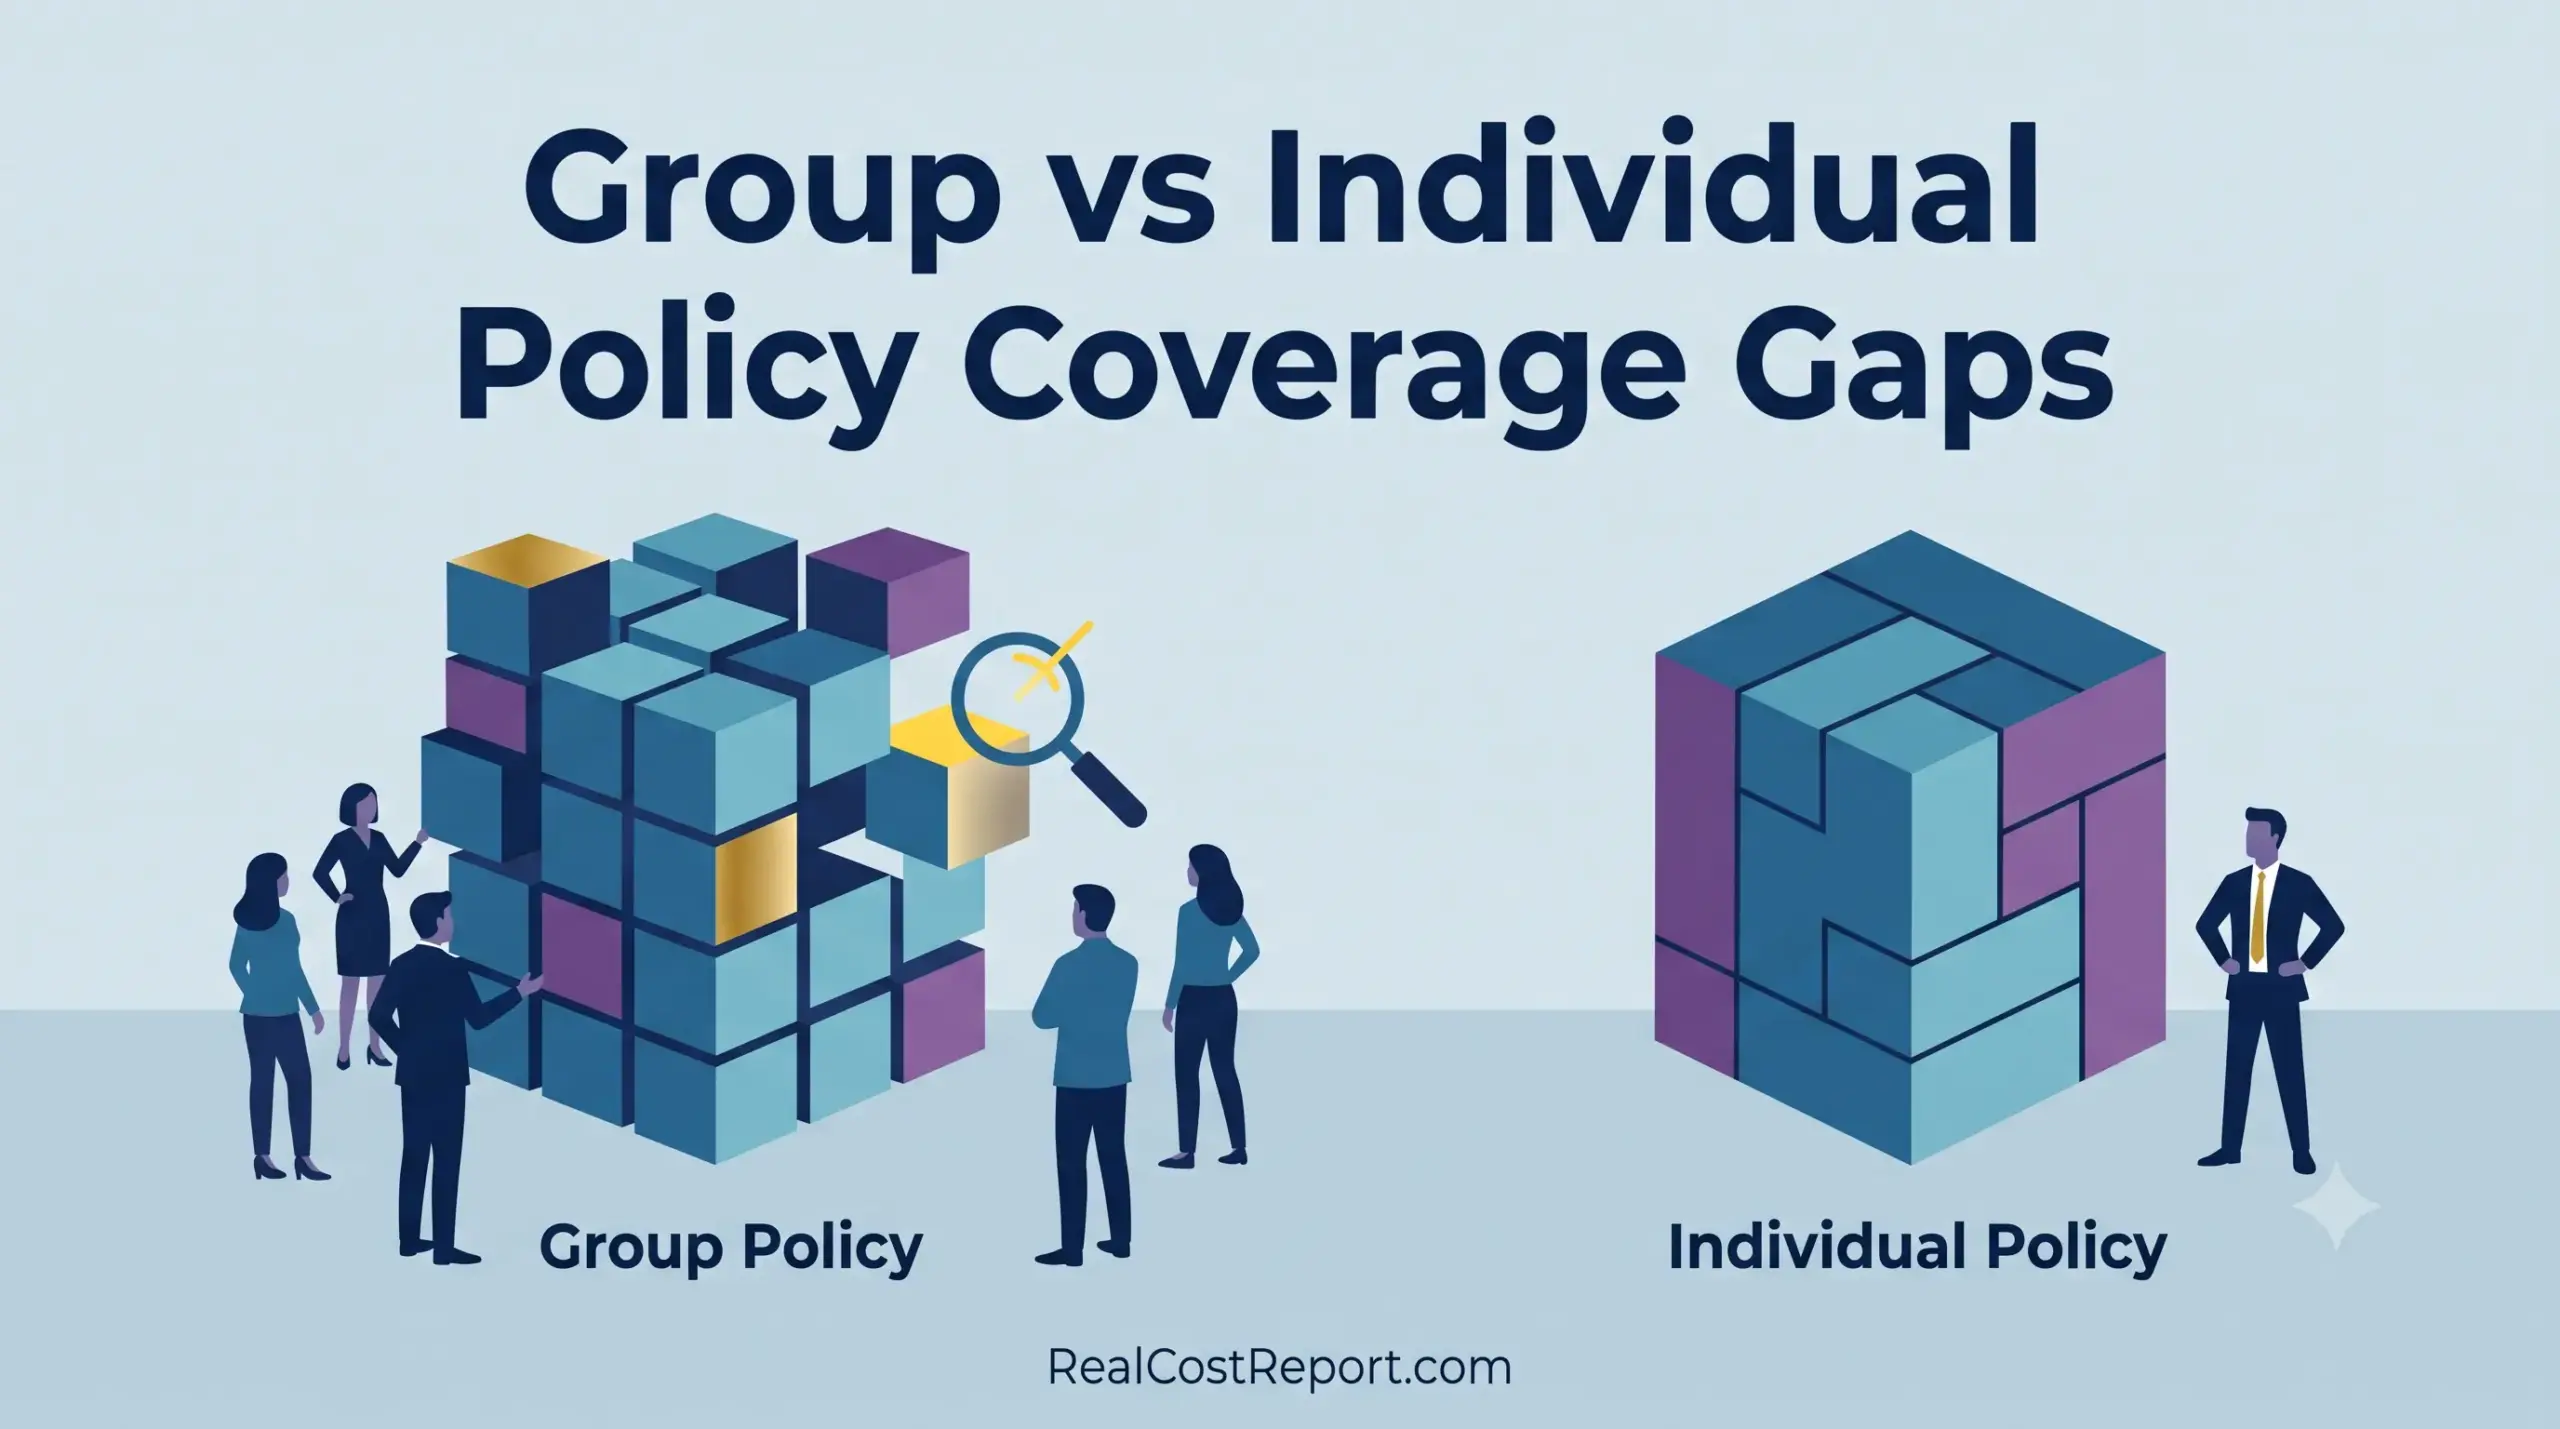
An illustration comparing a 'Group Policy' with a missing piece to a solid 'Individual Policy' cube with no gaps.

Group vs Individual Life Insurance: The 2026 Coverage Gap That Costs Families $500,000

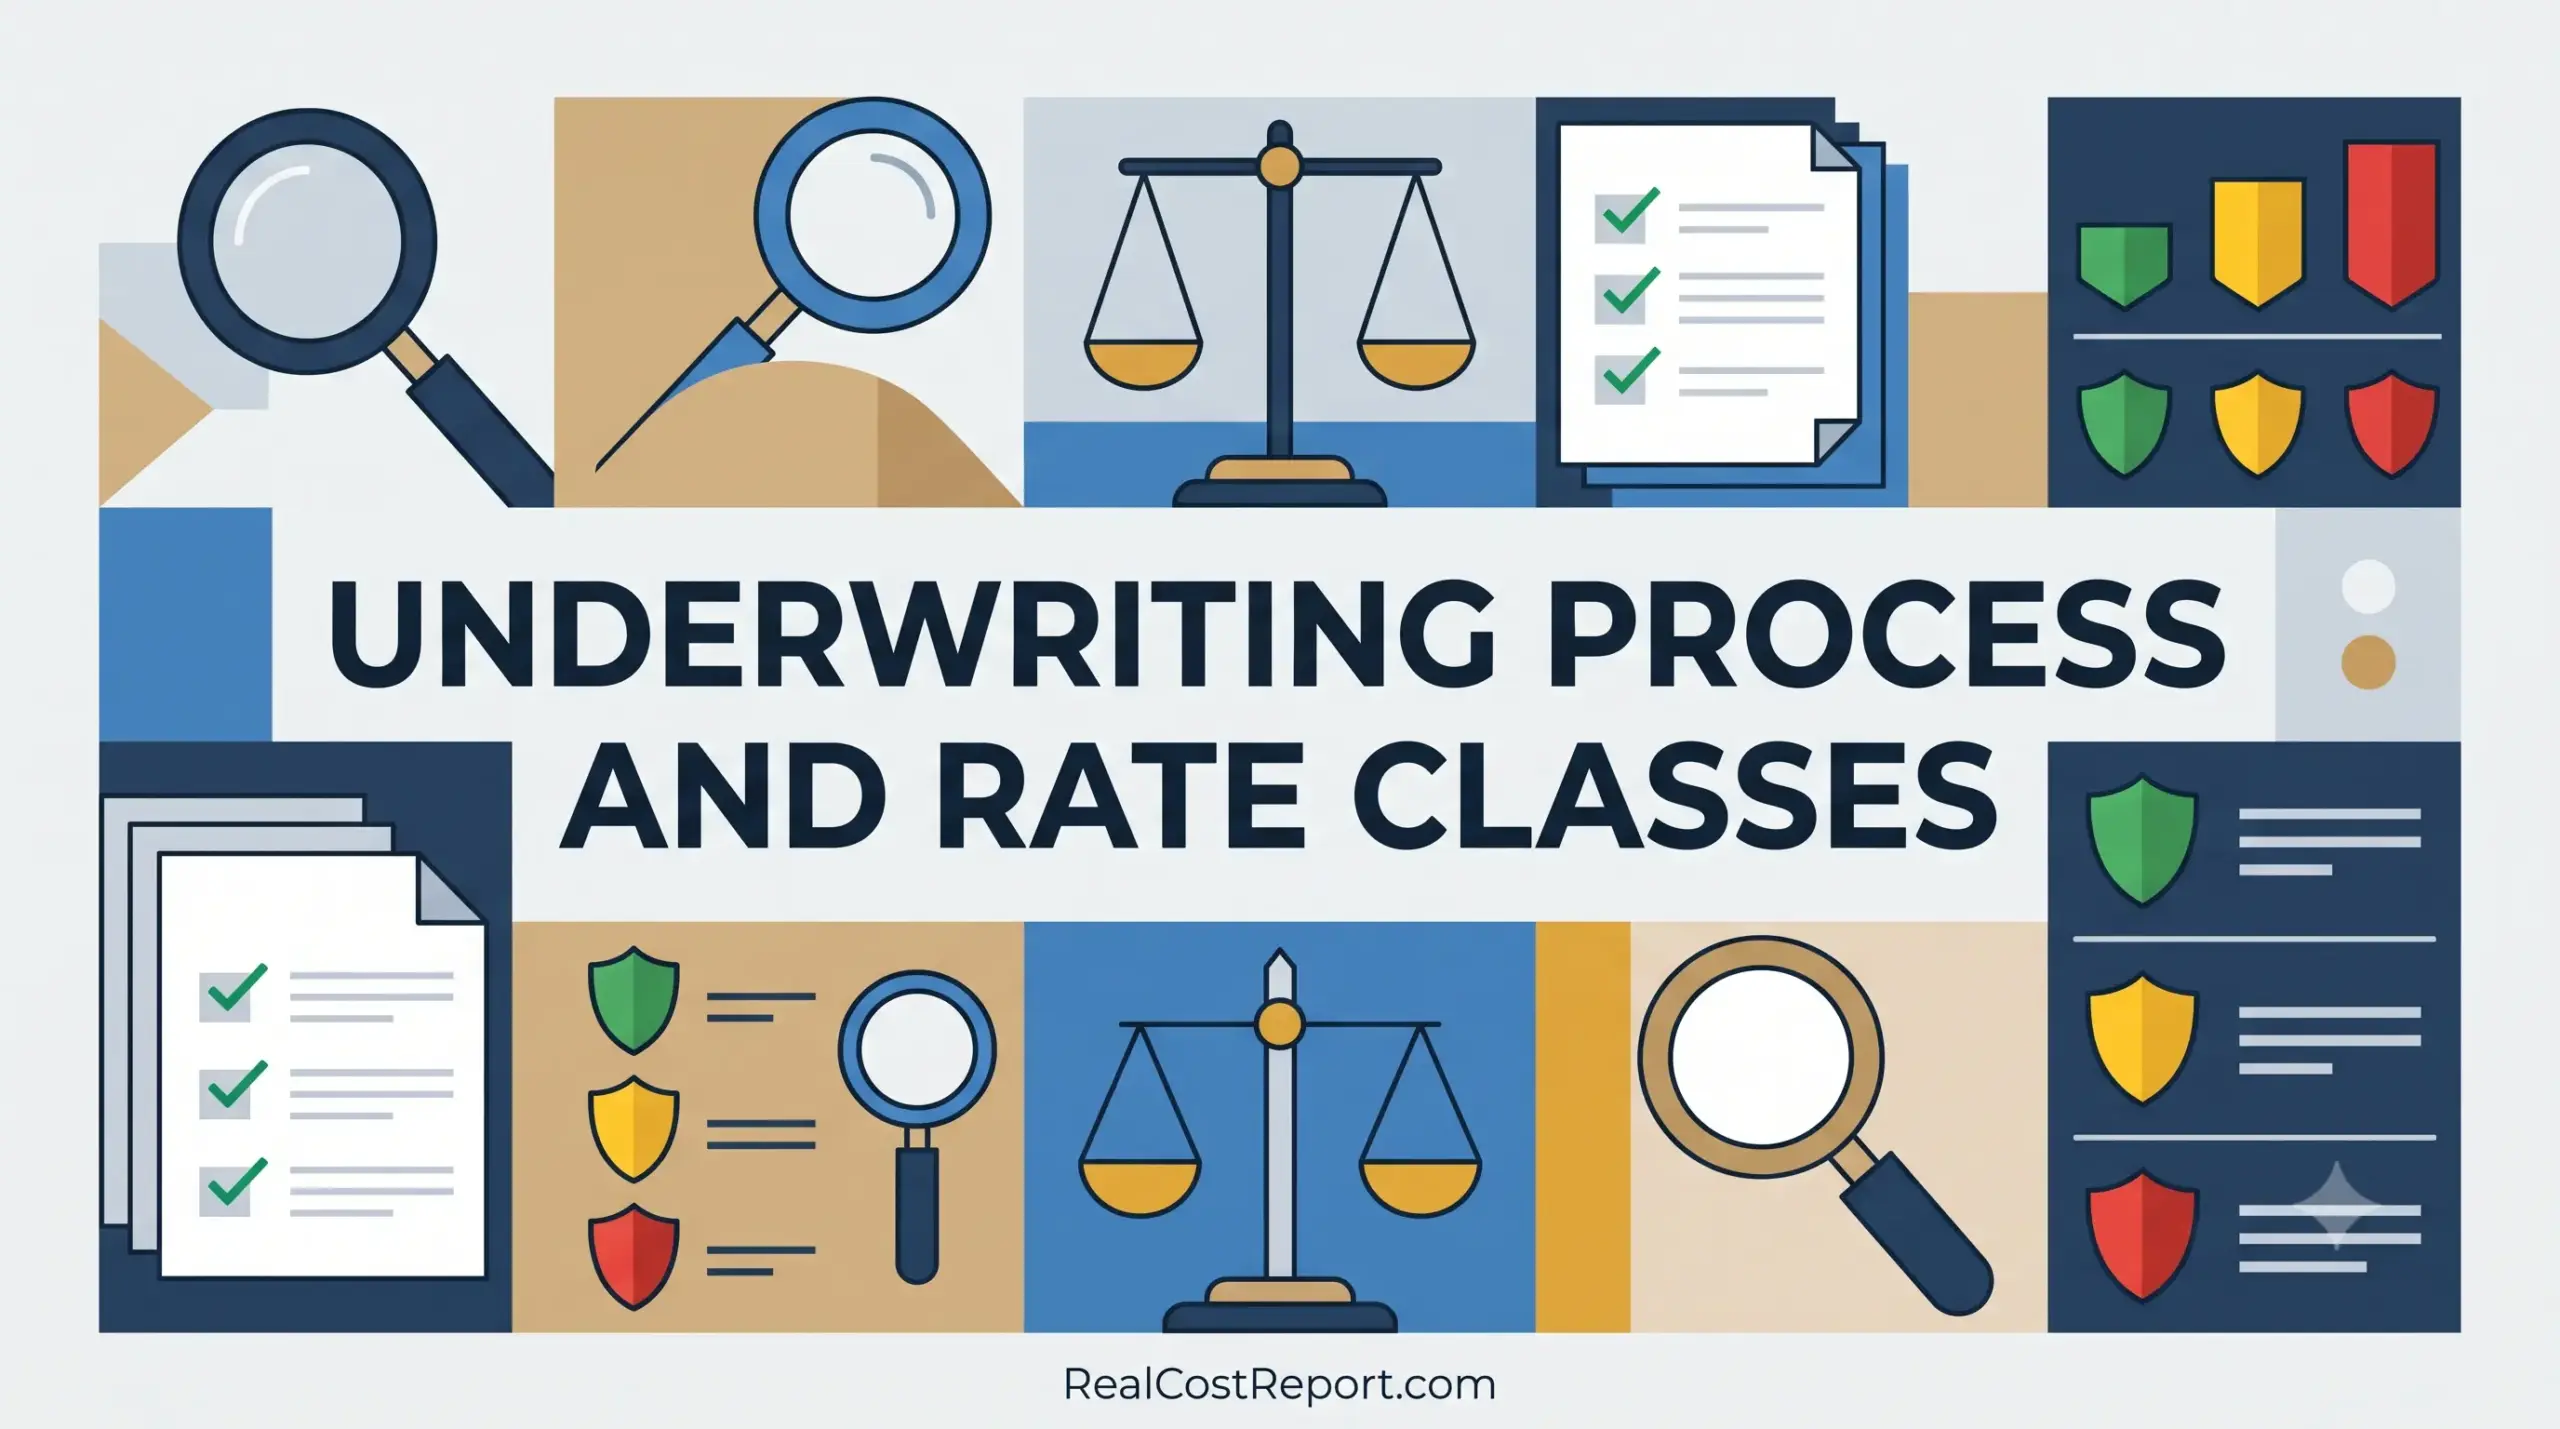
An infographic illustration for "Underwriting Process and Rate Classes" showing icons for analysis, balance, and risk categories on RealCostReport.com.

Life Insurance Underwriting Process and Rate Classes: How Much Each Class Costs in 2026

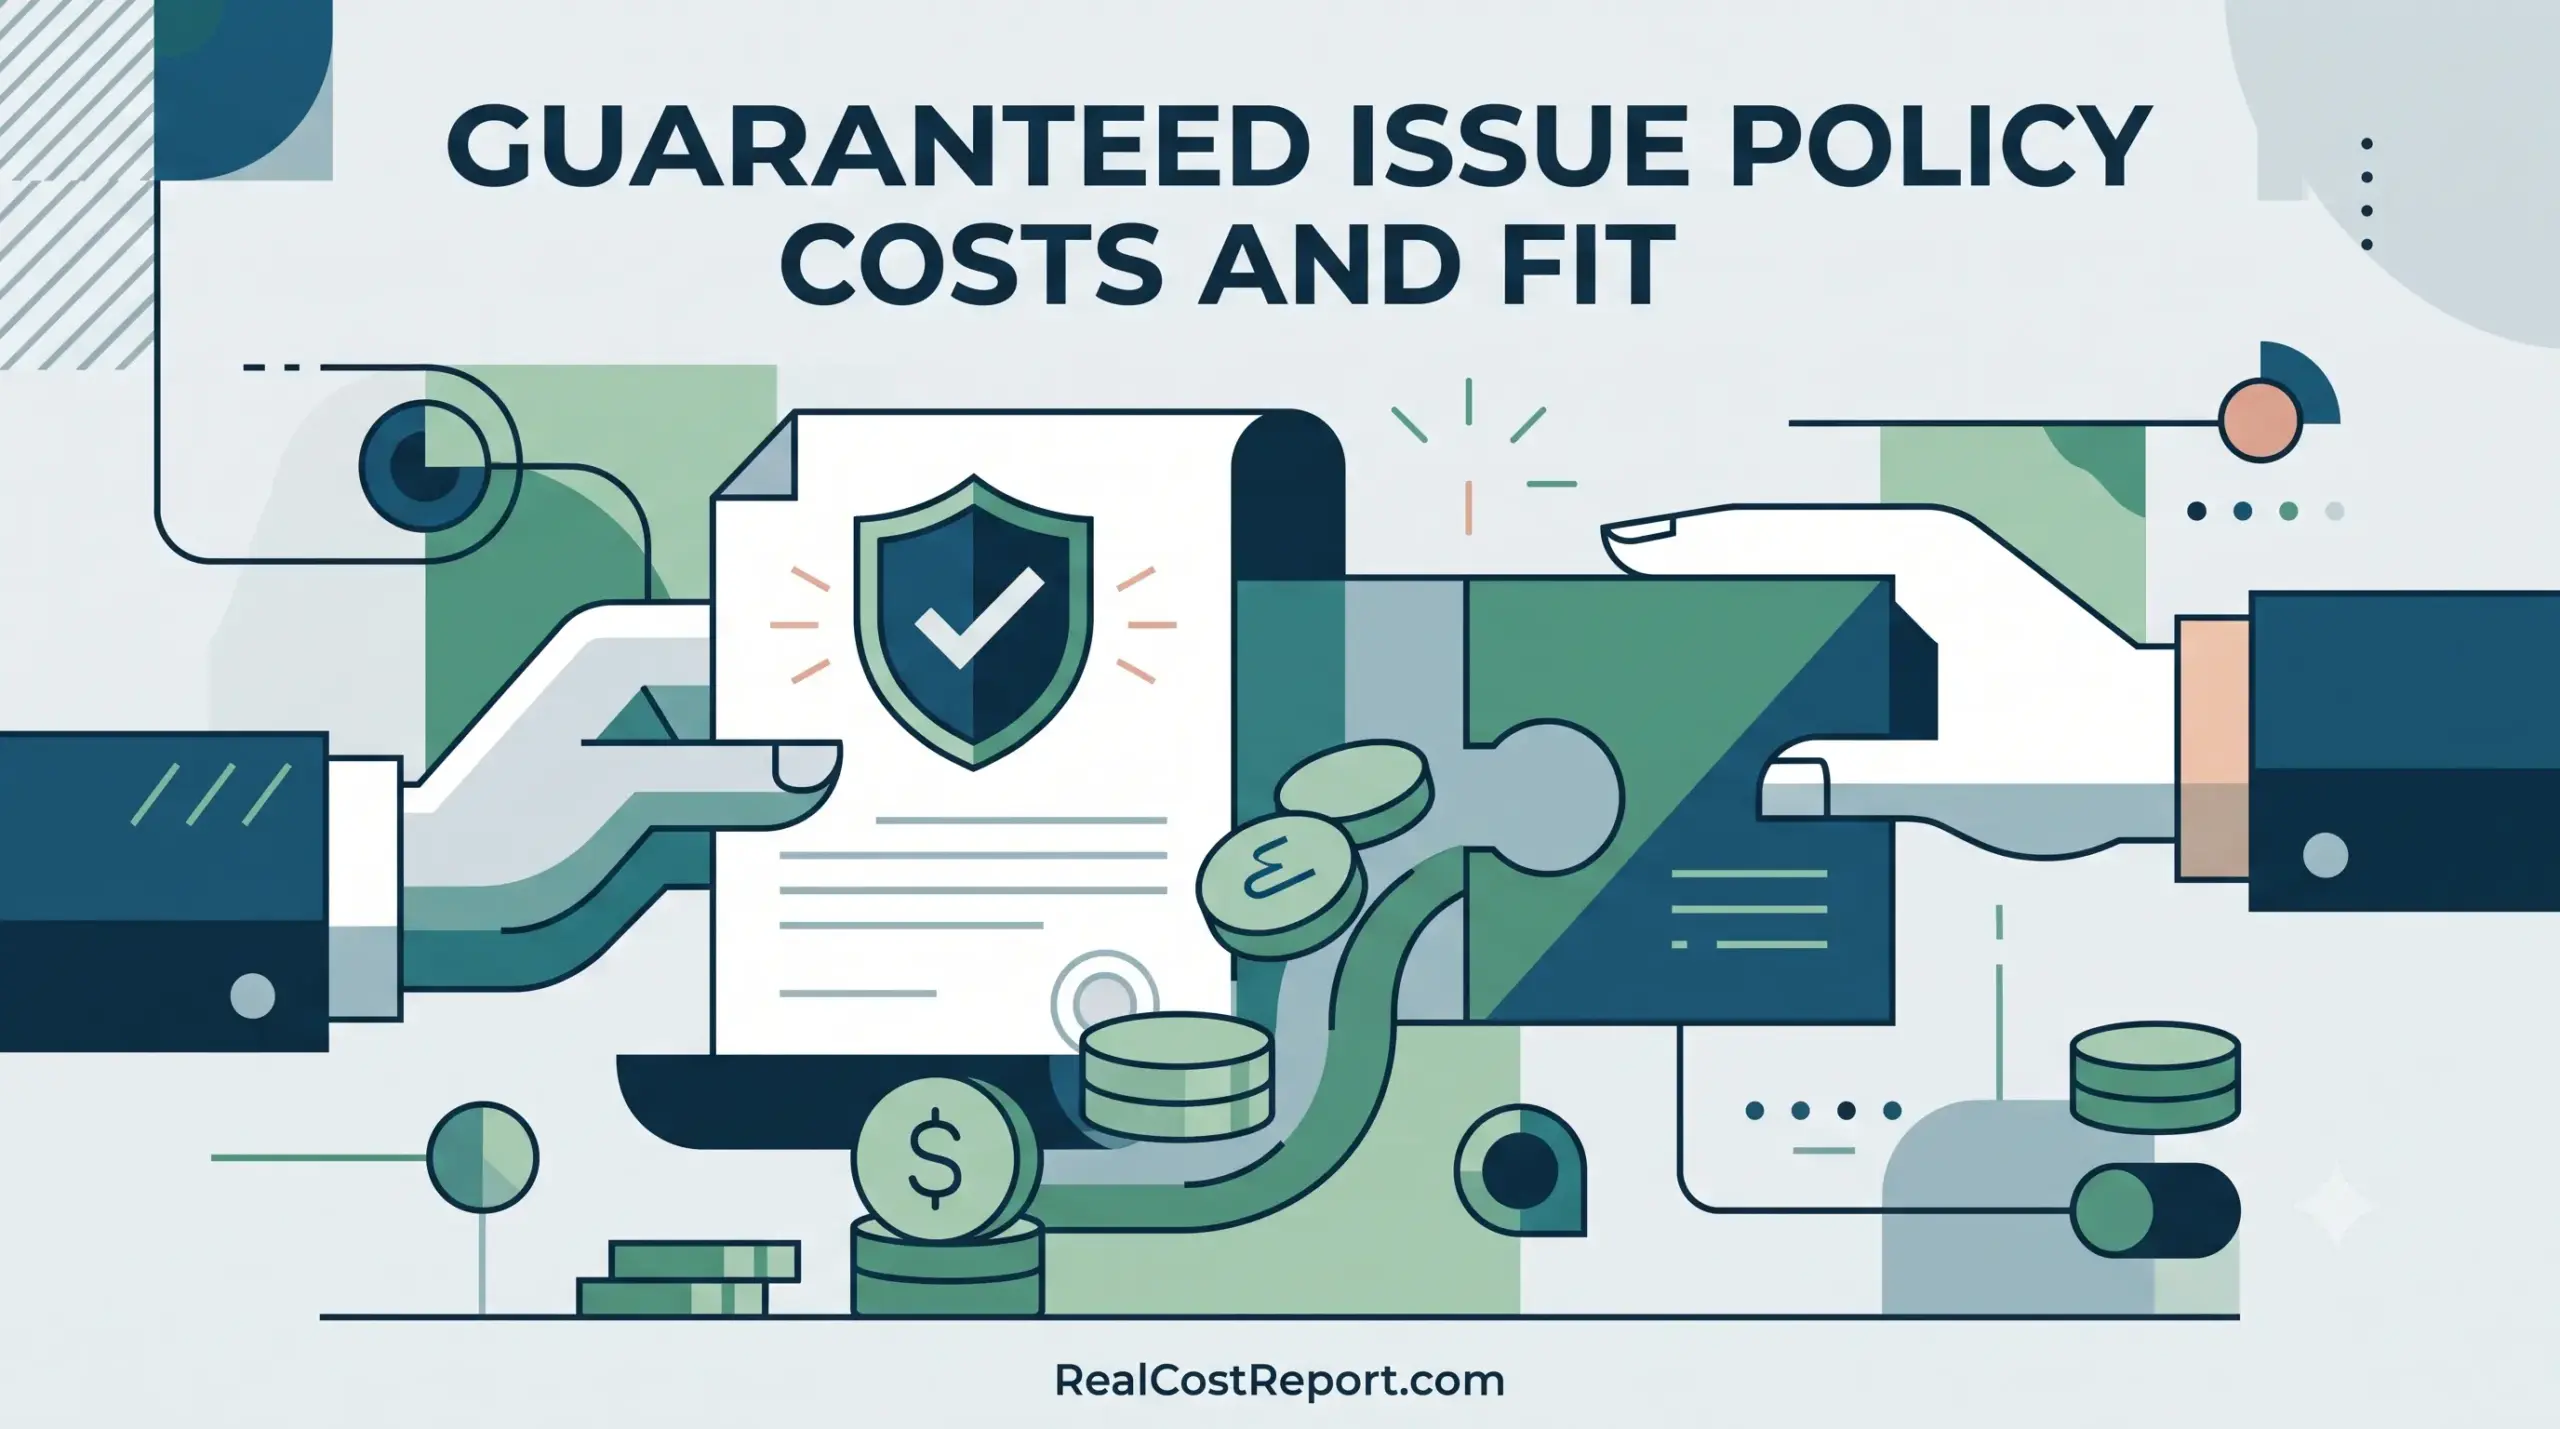
A vector illustration with text that reads "Guaranteed Issue Policy Costs and Fit" above a business-style scene.

Guaranteed Issue Life Insurance Cost 2026: Is It Worth It, and Who Actually Needs It?

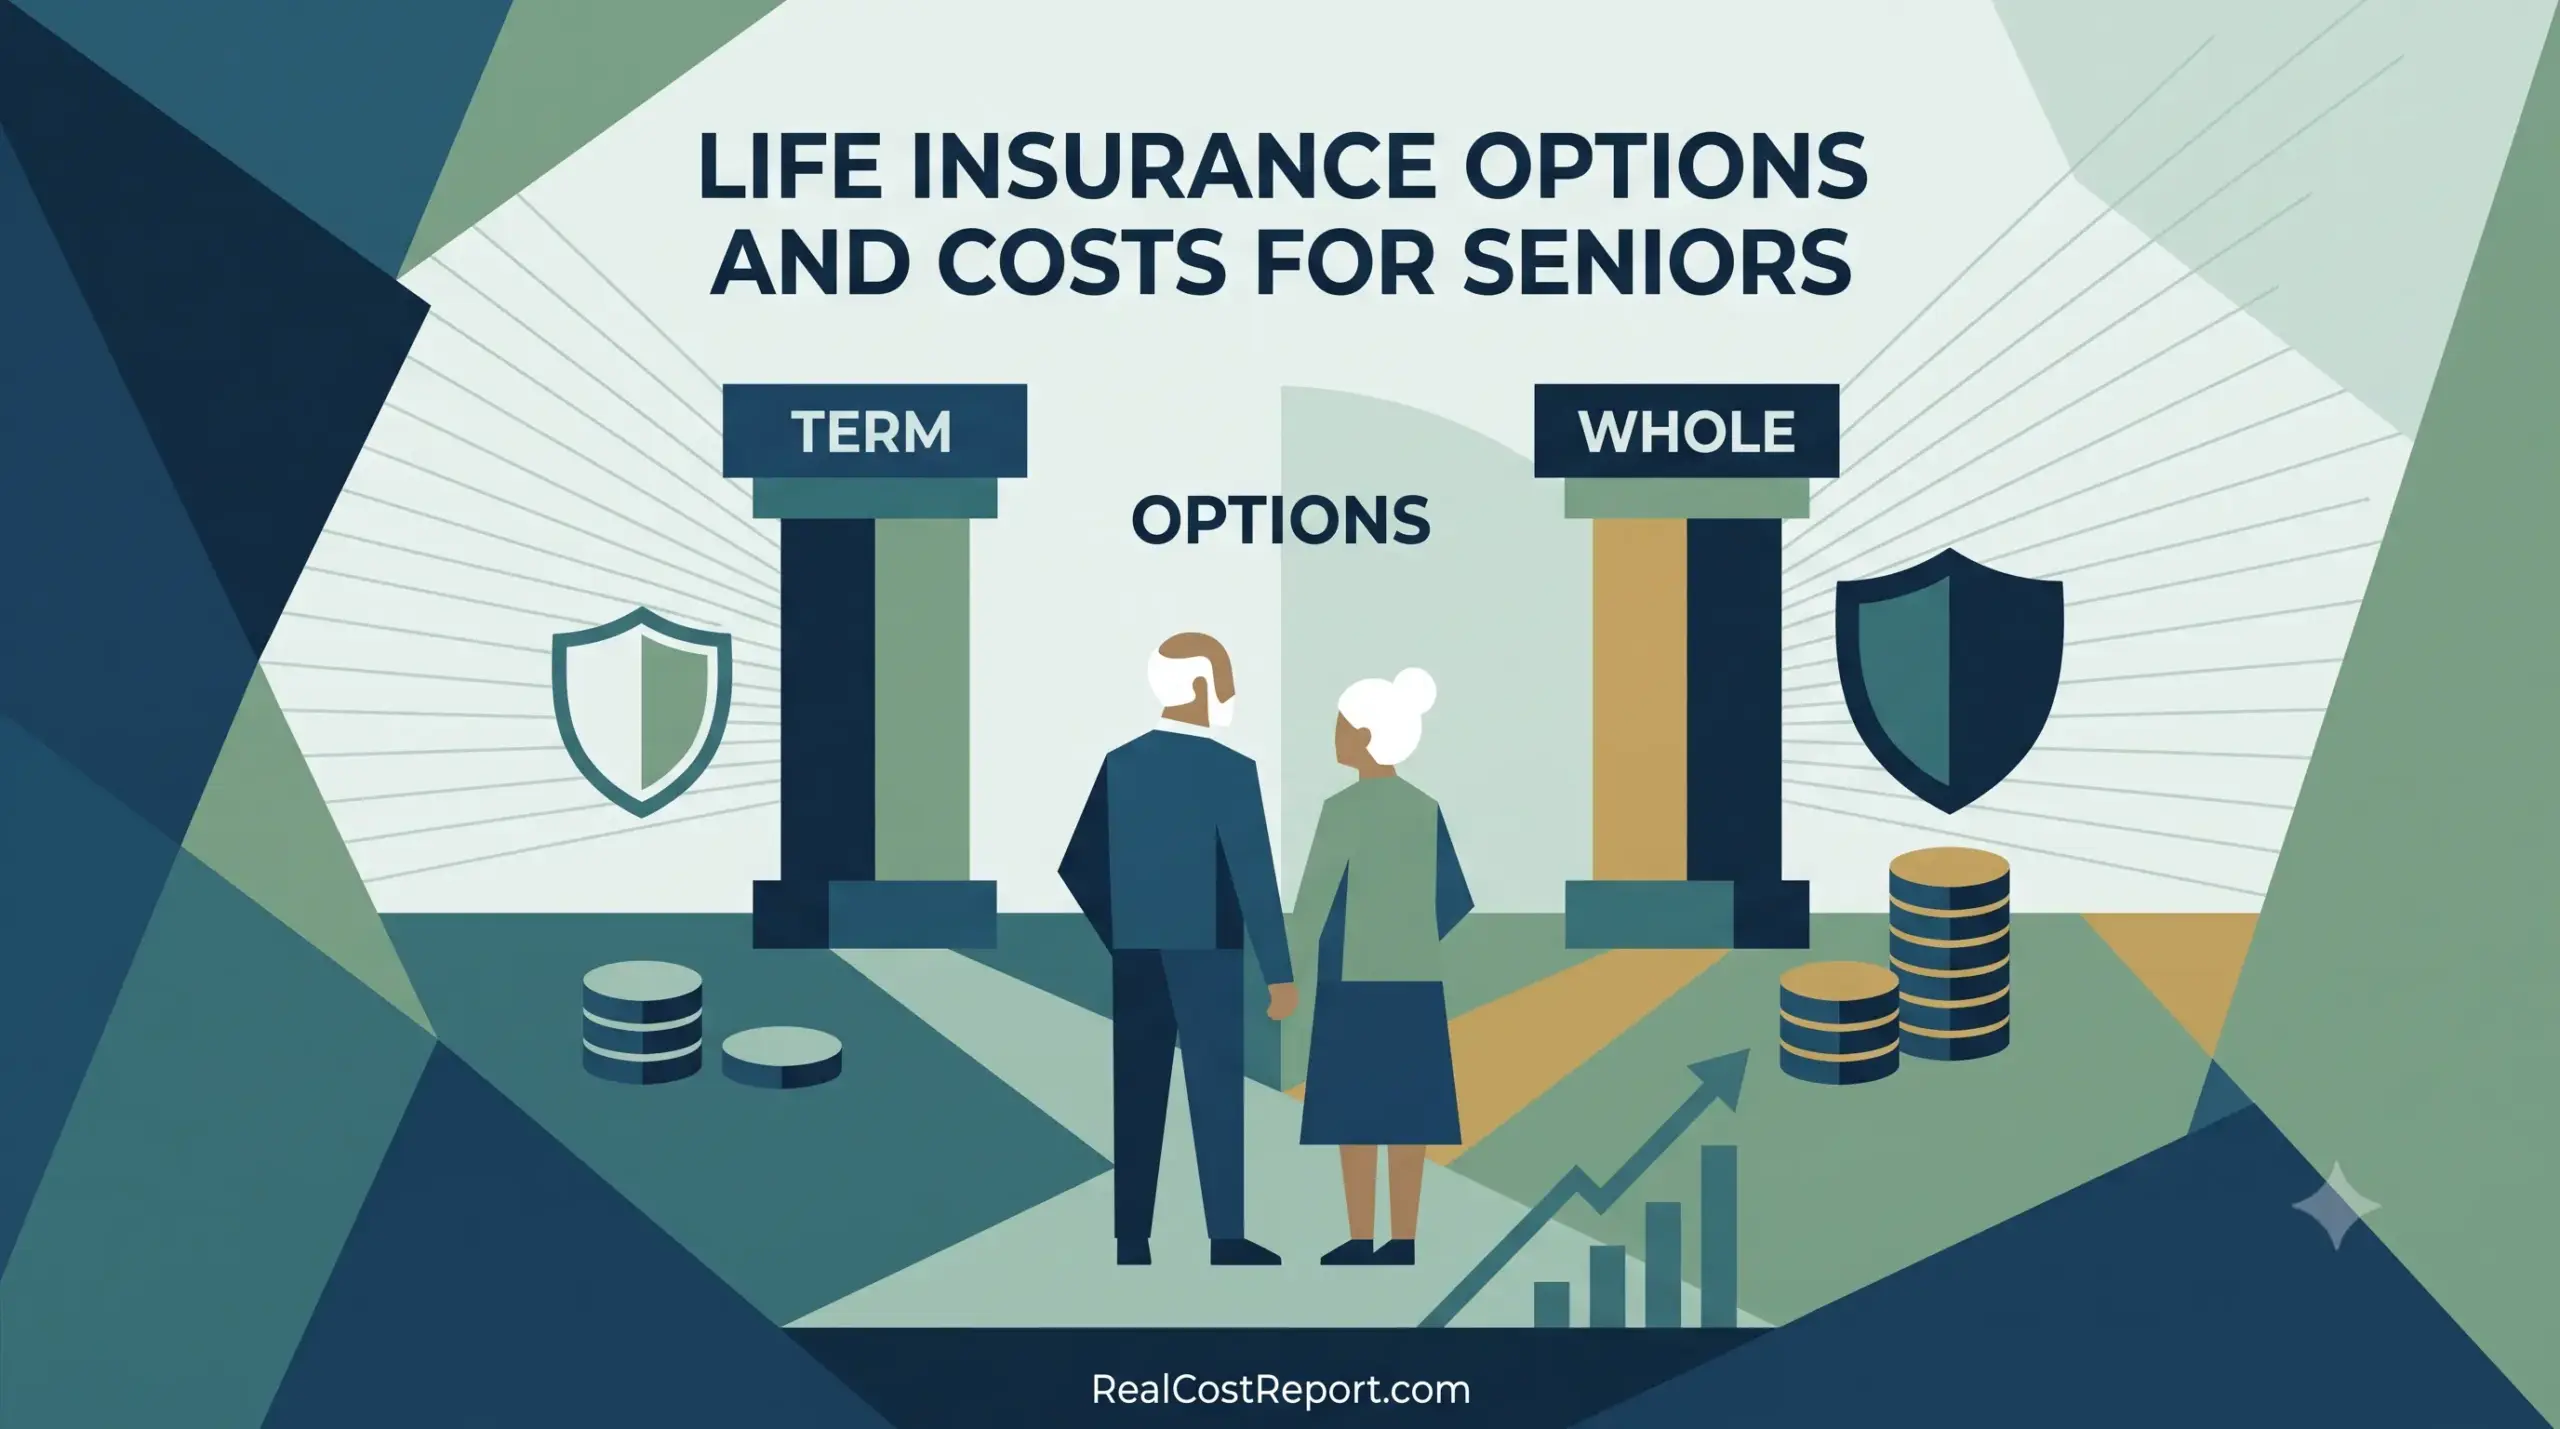
An illustration of a senior couple considering term and whole life insurance options with varying costs.

Life Insurance for Seniors in 2026: How Much It Costs and Which Option Is Worth It

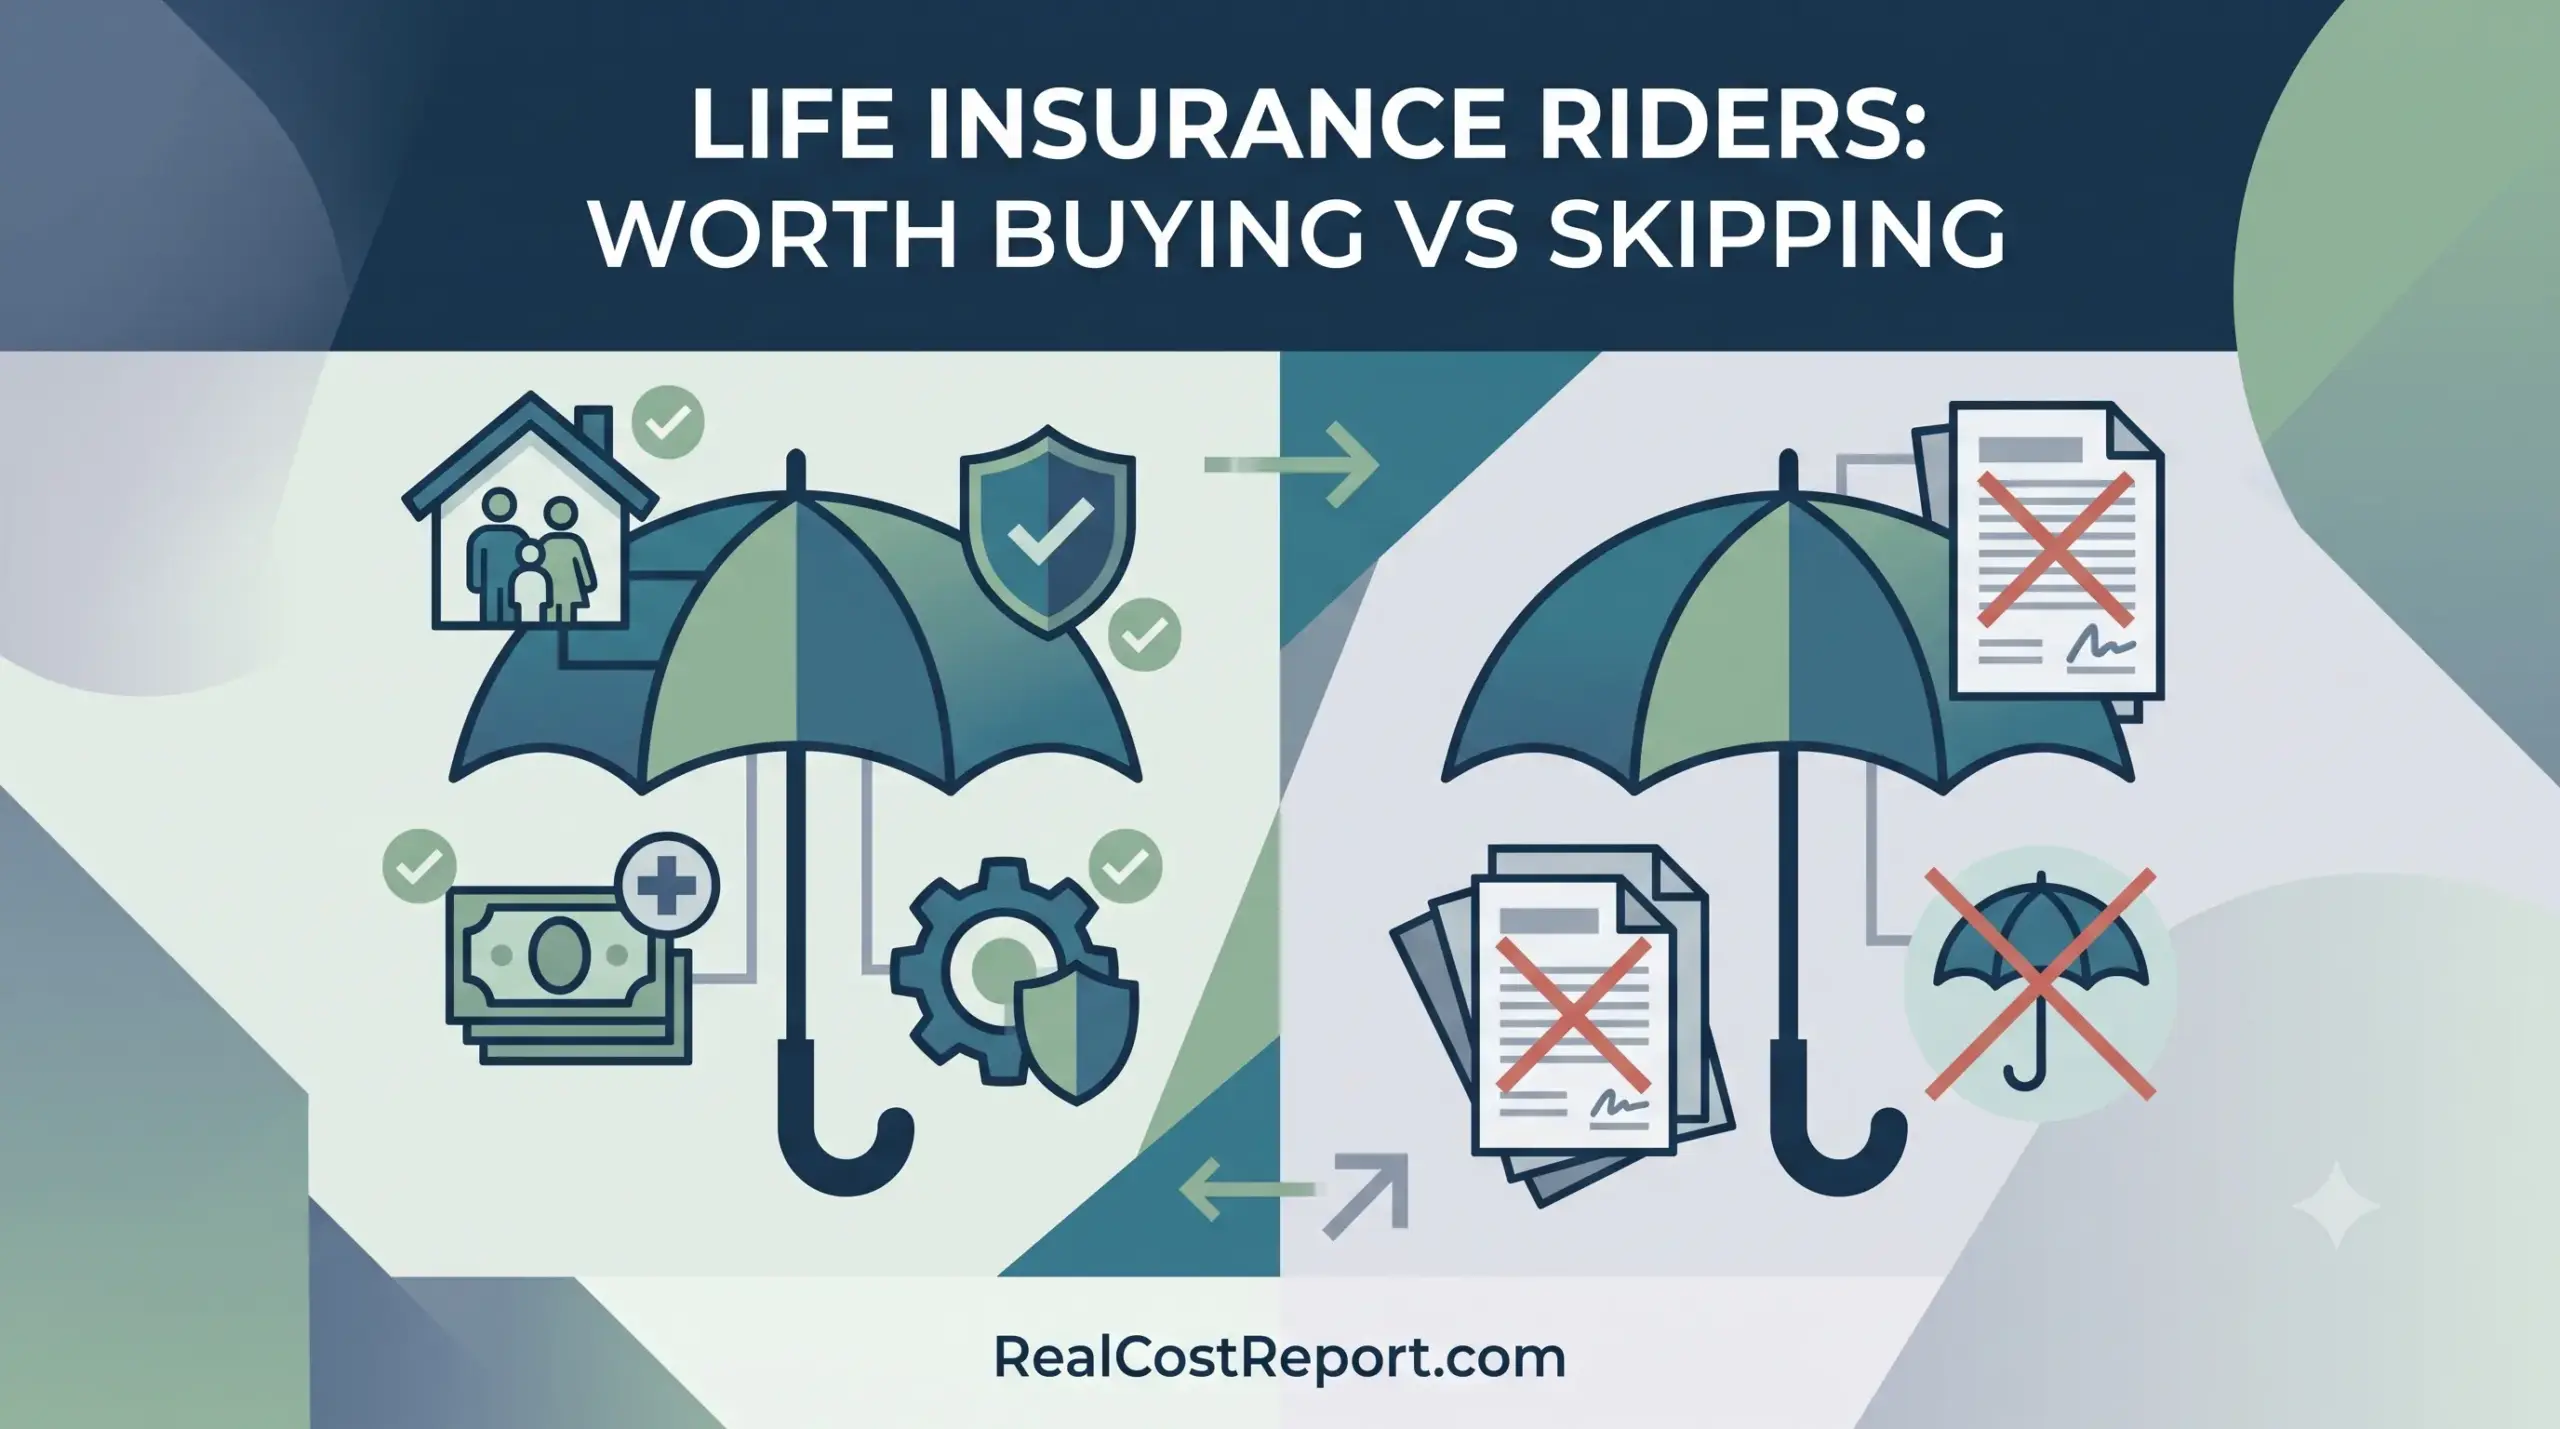
A comparison graphic illustration showing beneficial versus unnecessary life insurance riders with umbrellas, checks, and 'X' marks.

Life Insurance Riders Worth Buying vs Skipping in 2026: What Each One Actually Costs

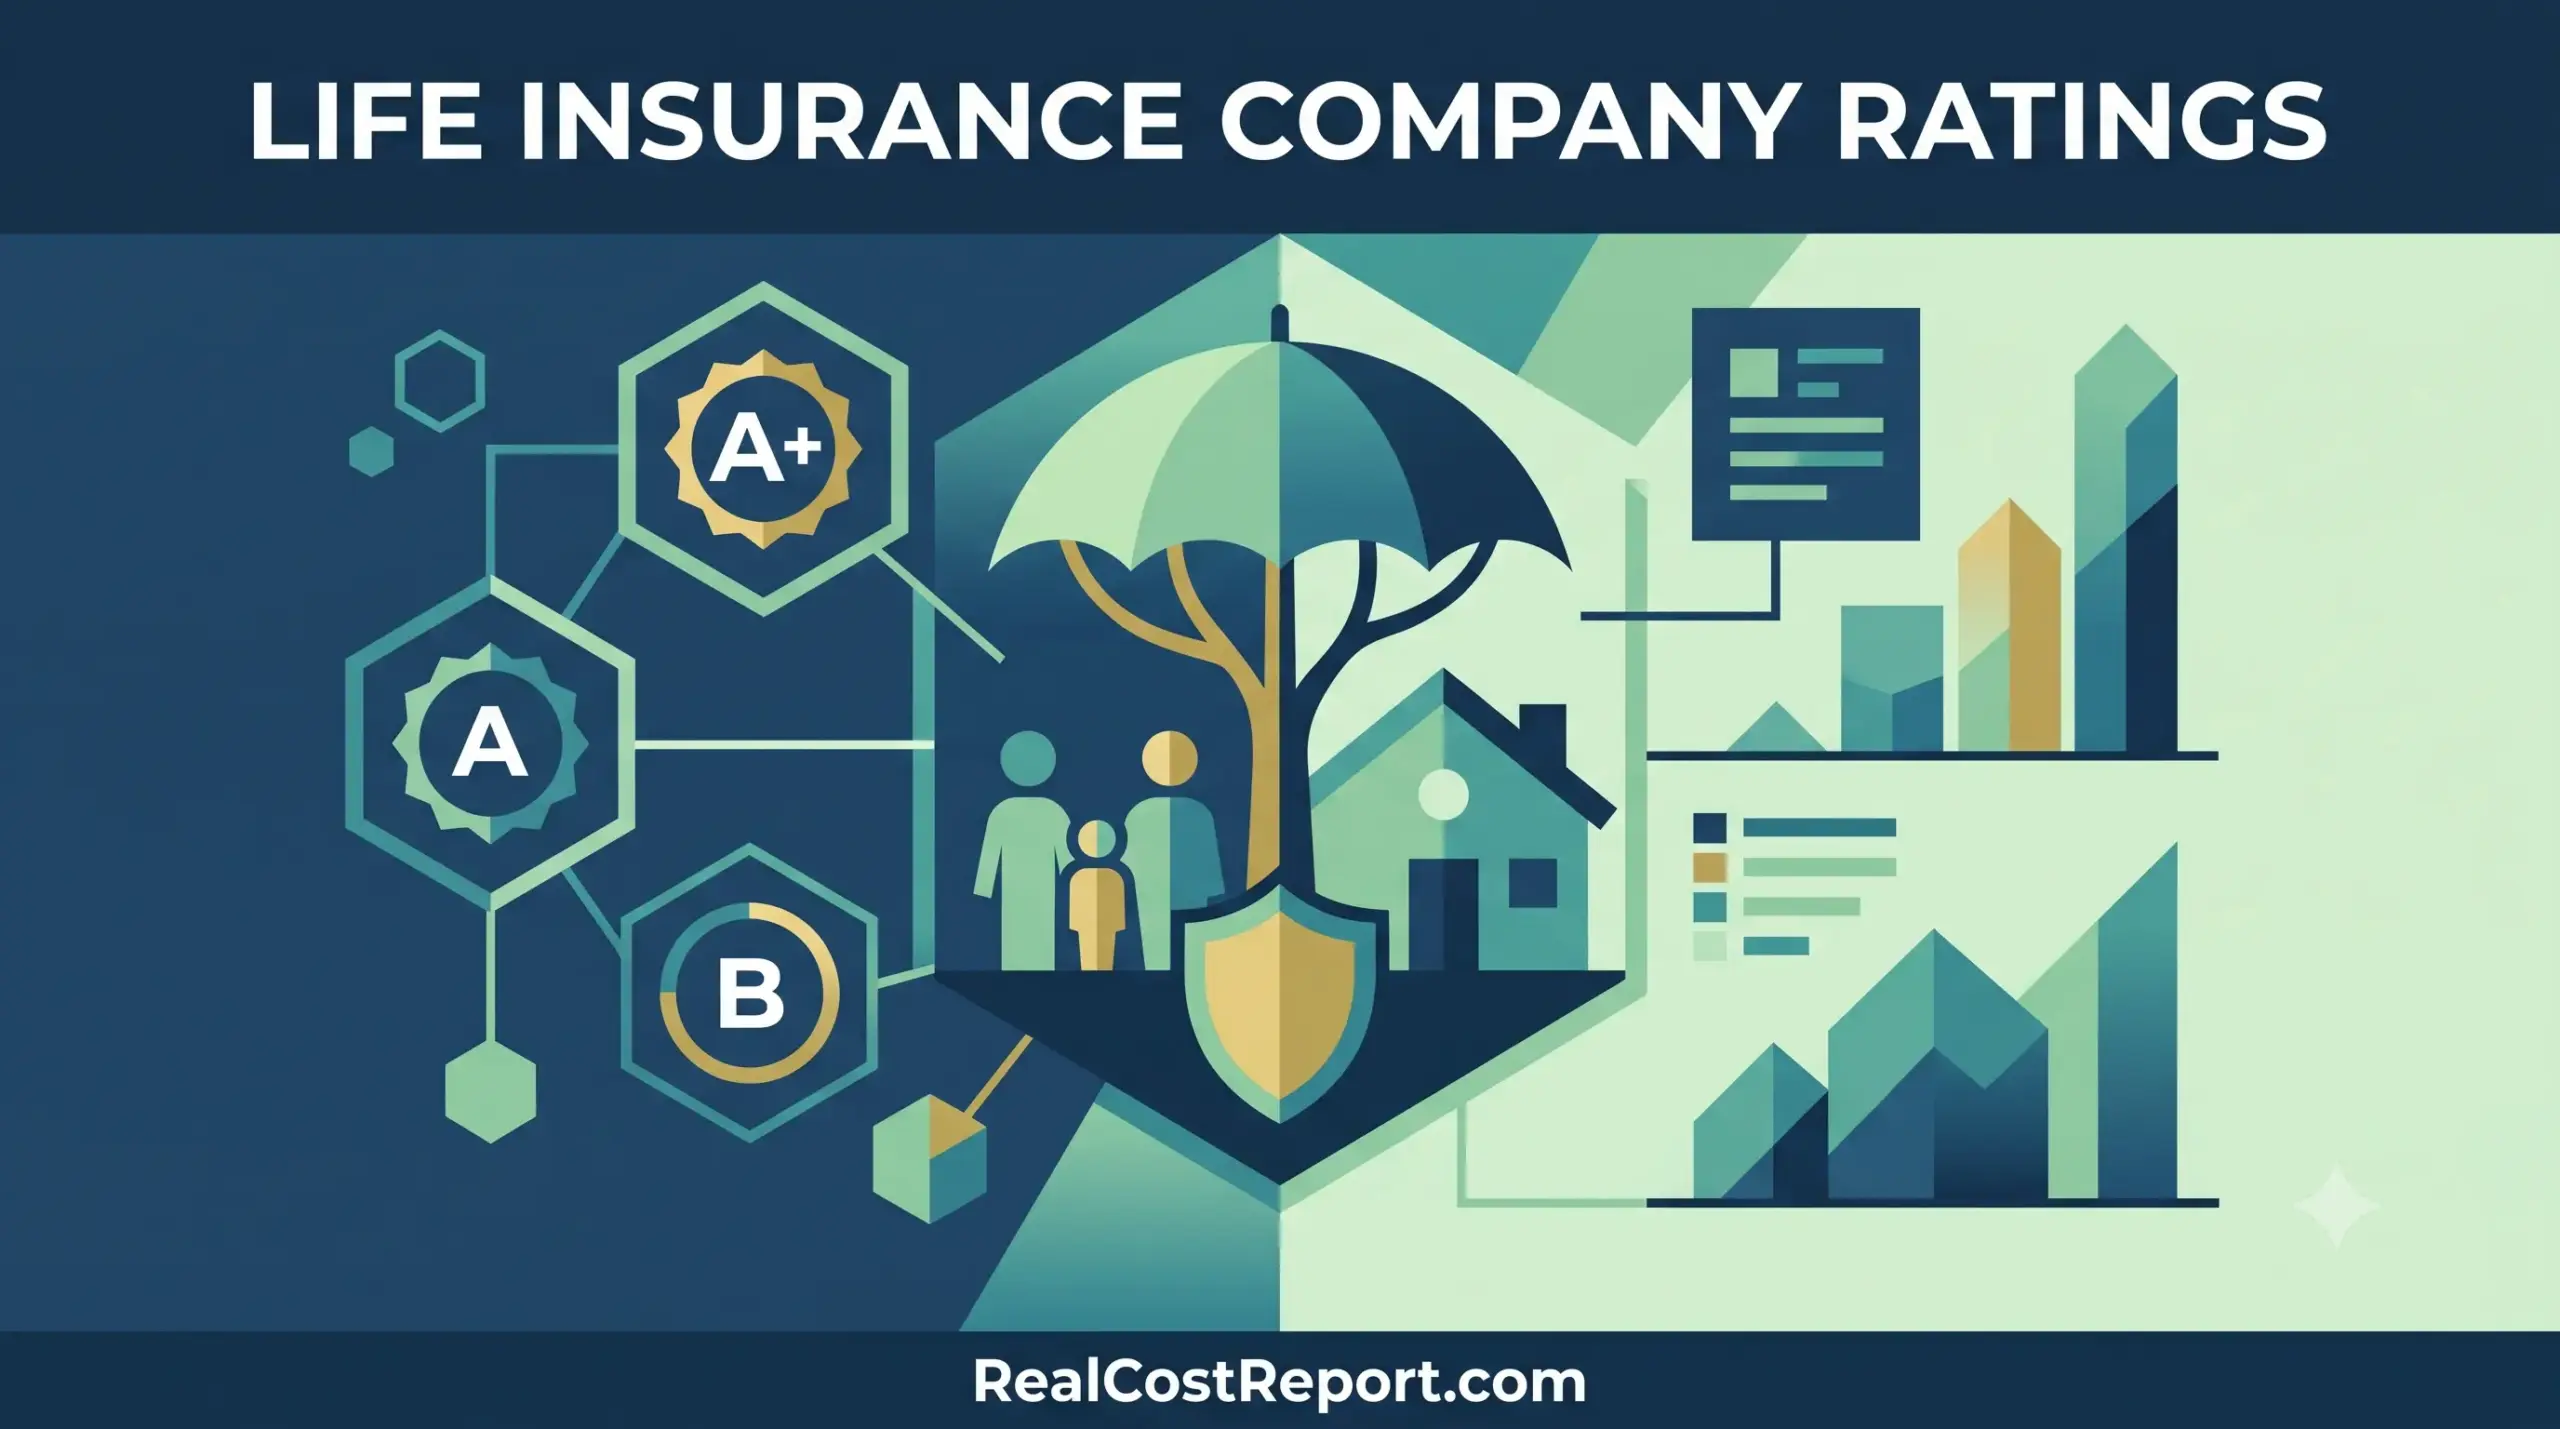
Modern geometric vector illustration representing life insurance with stylized protection icons, company rating labels (A+, A, B), and bar graphs without specific numbers on a professional blue and green background.

Life Insurance Company Ratings and Rate Data 2026: What A++ Really Costs You

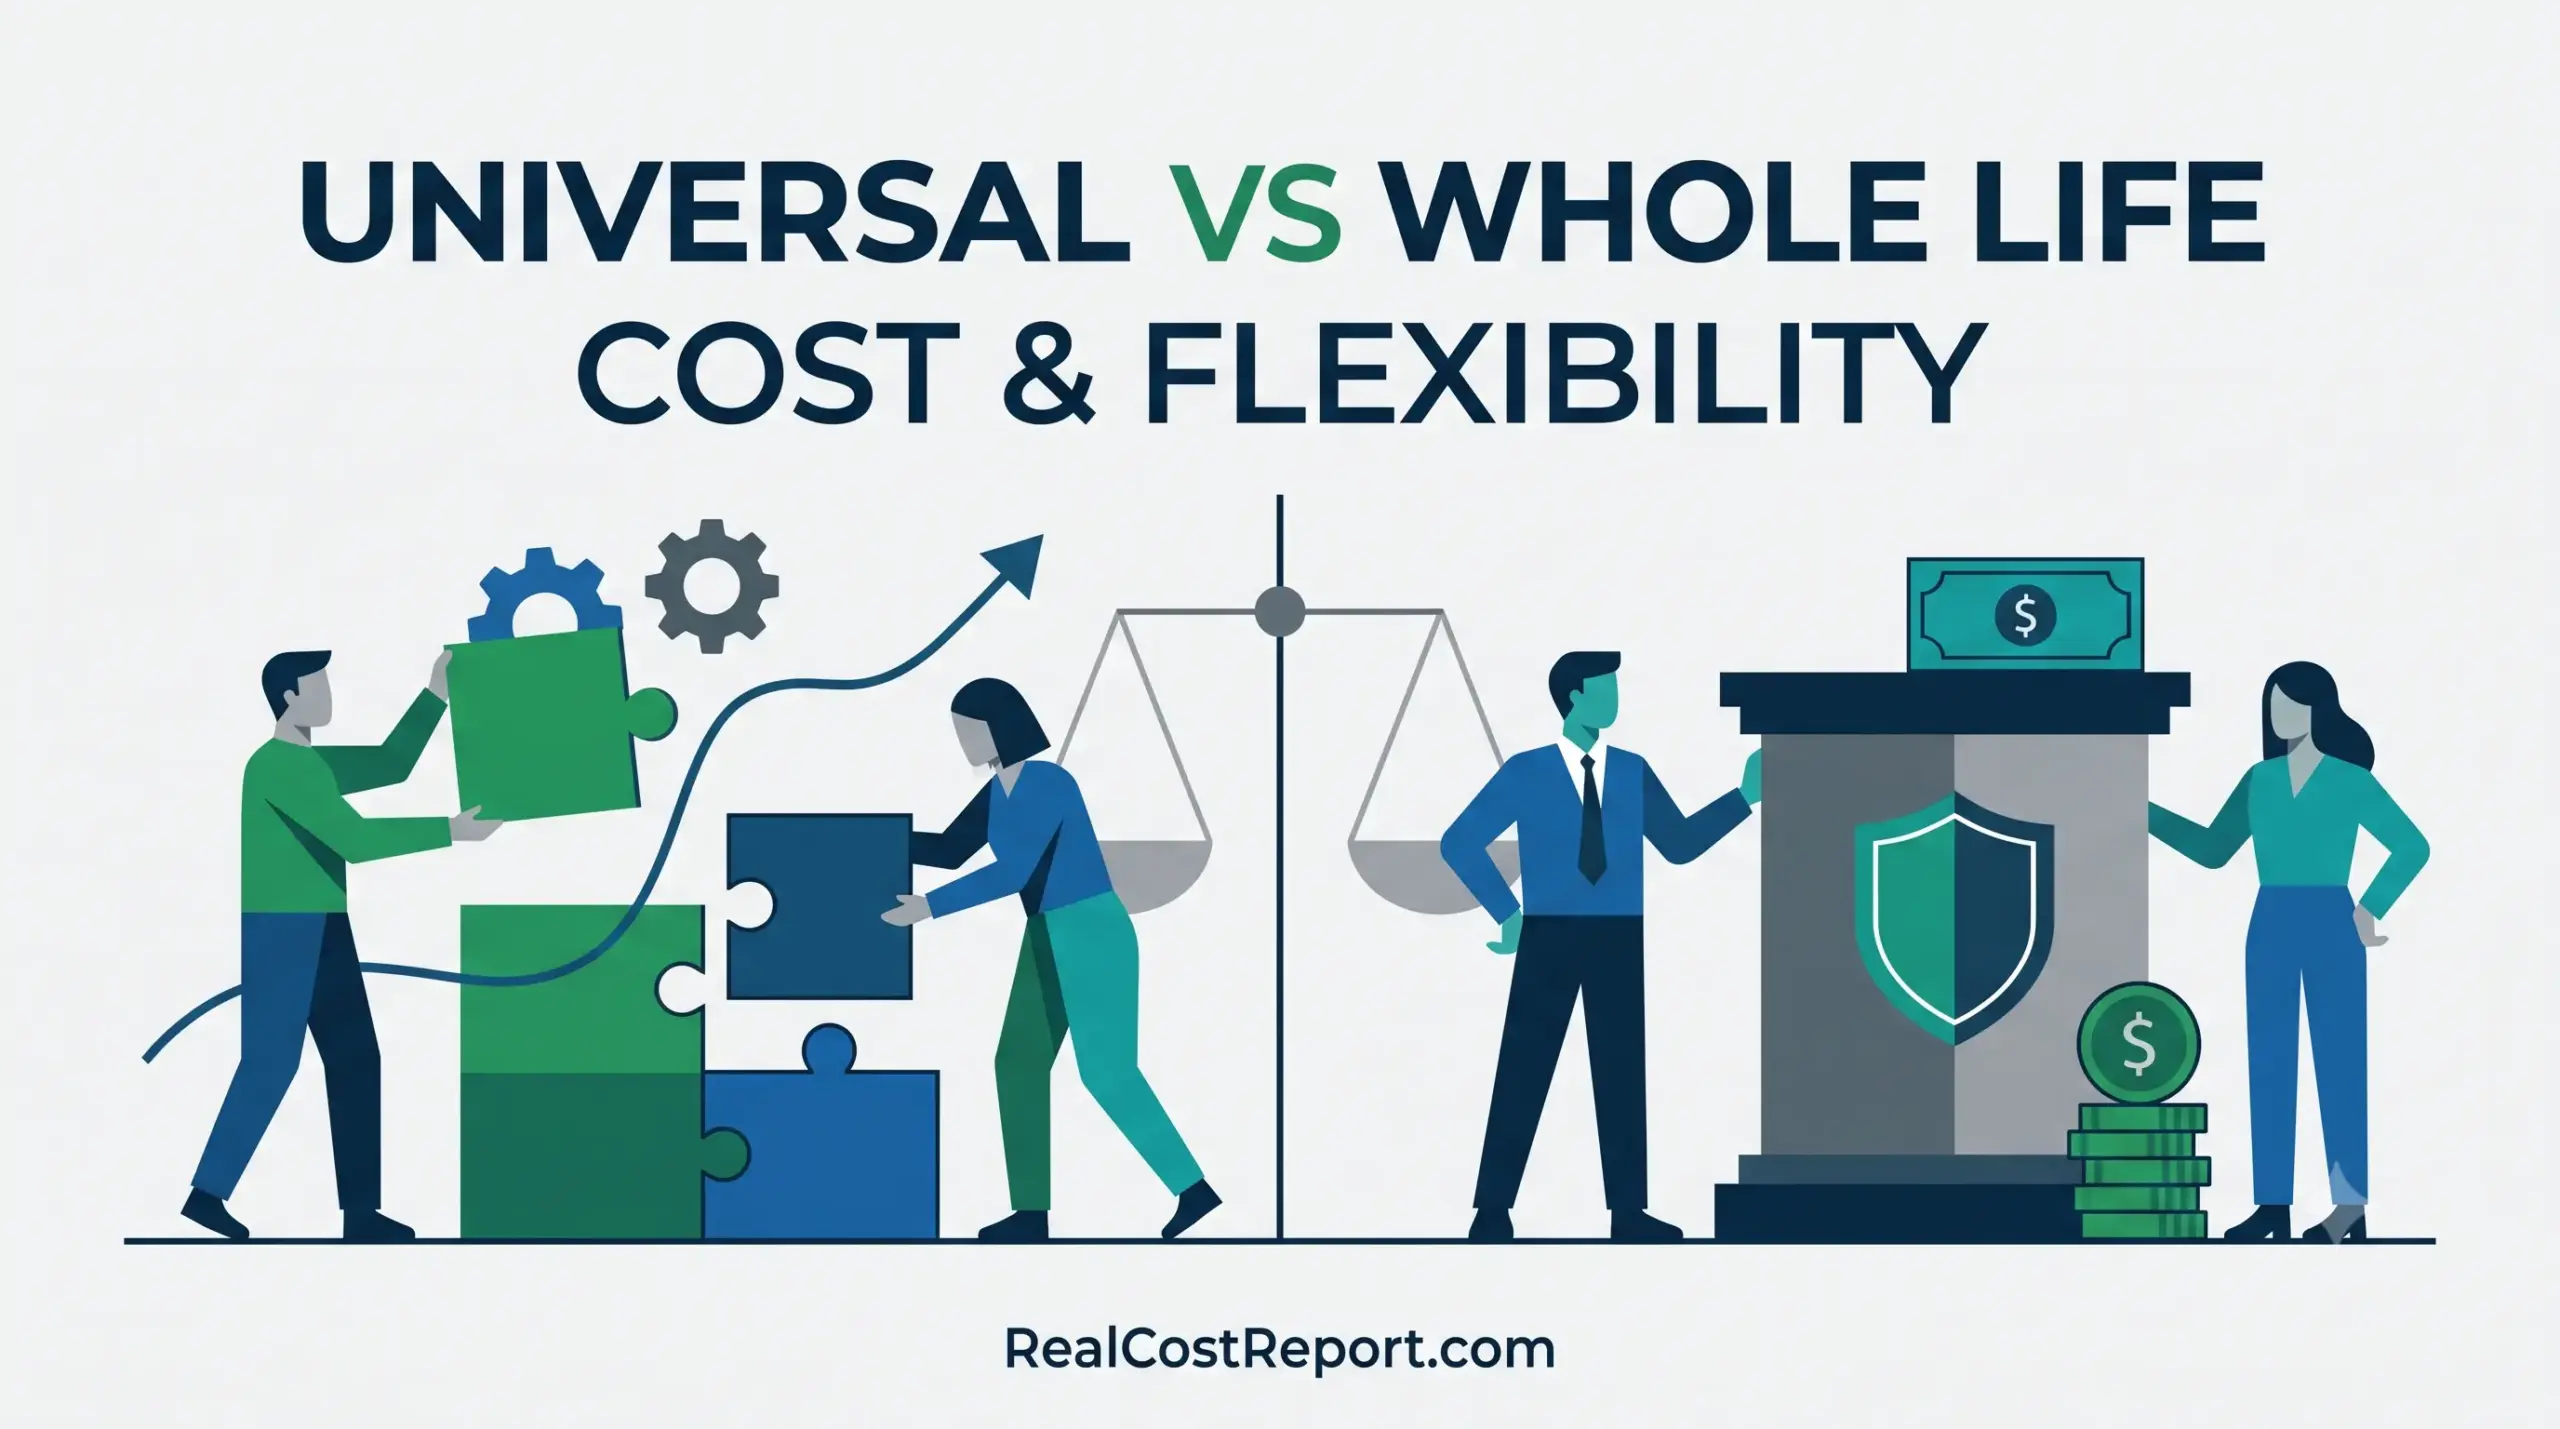
A modern flat illustration comparing adjustable puzzle pieces for universal life and a stable shield for whole life insurance.

Universal vs Whole Life Insurance 2026: True Cost, Flexibility, and Which Is Worth It

A minimal geometric vector illustration showing rising blue and green columns, gears, and a compass to represent cash value growth.

Whole Life Cash Value Growth and Returns: What the 6.60% Dividend Rate Actually Pays in 2026

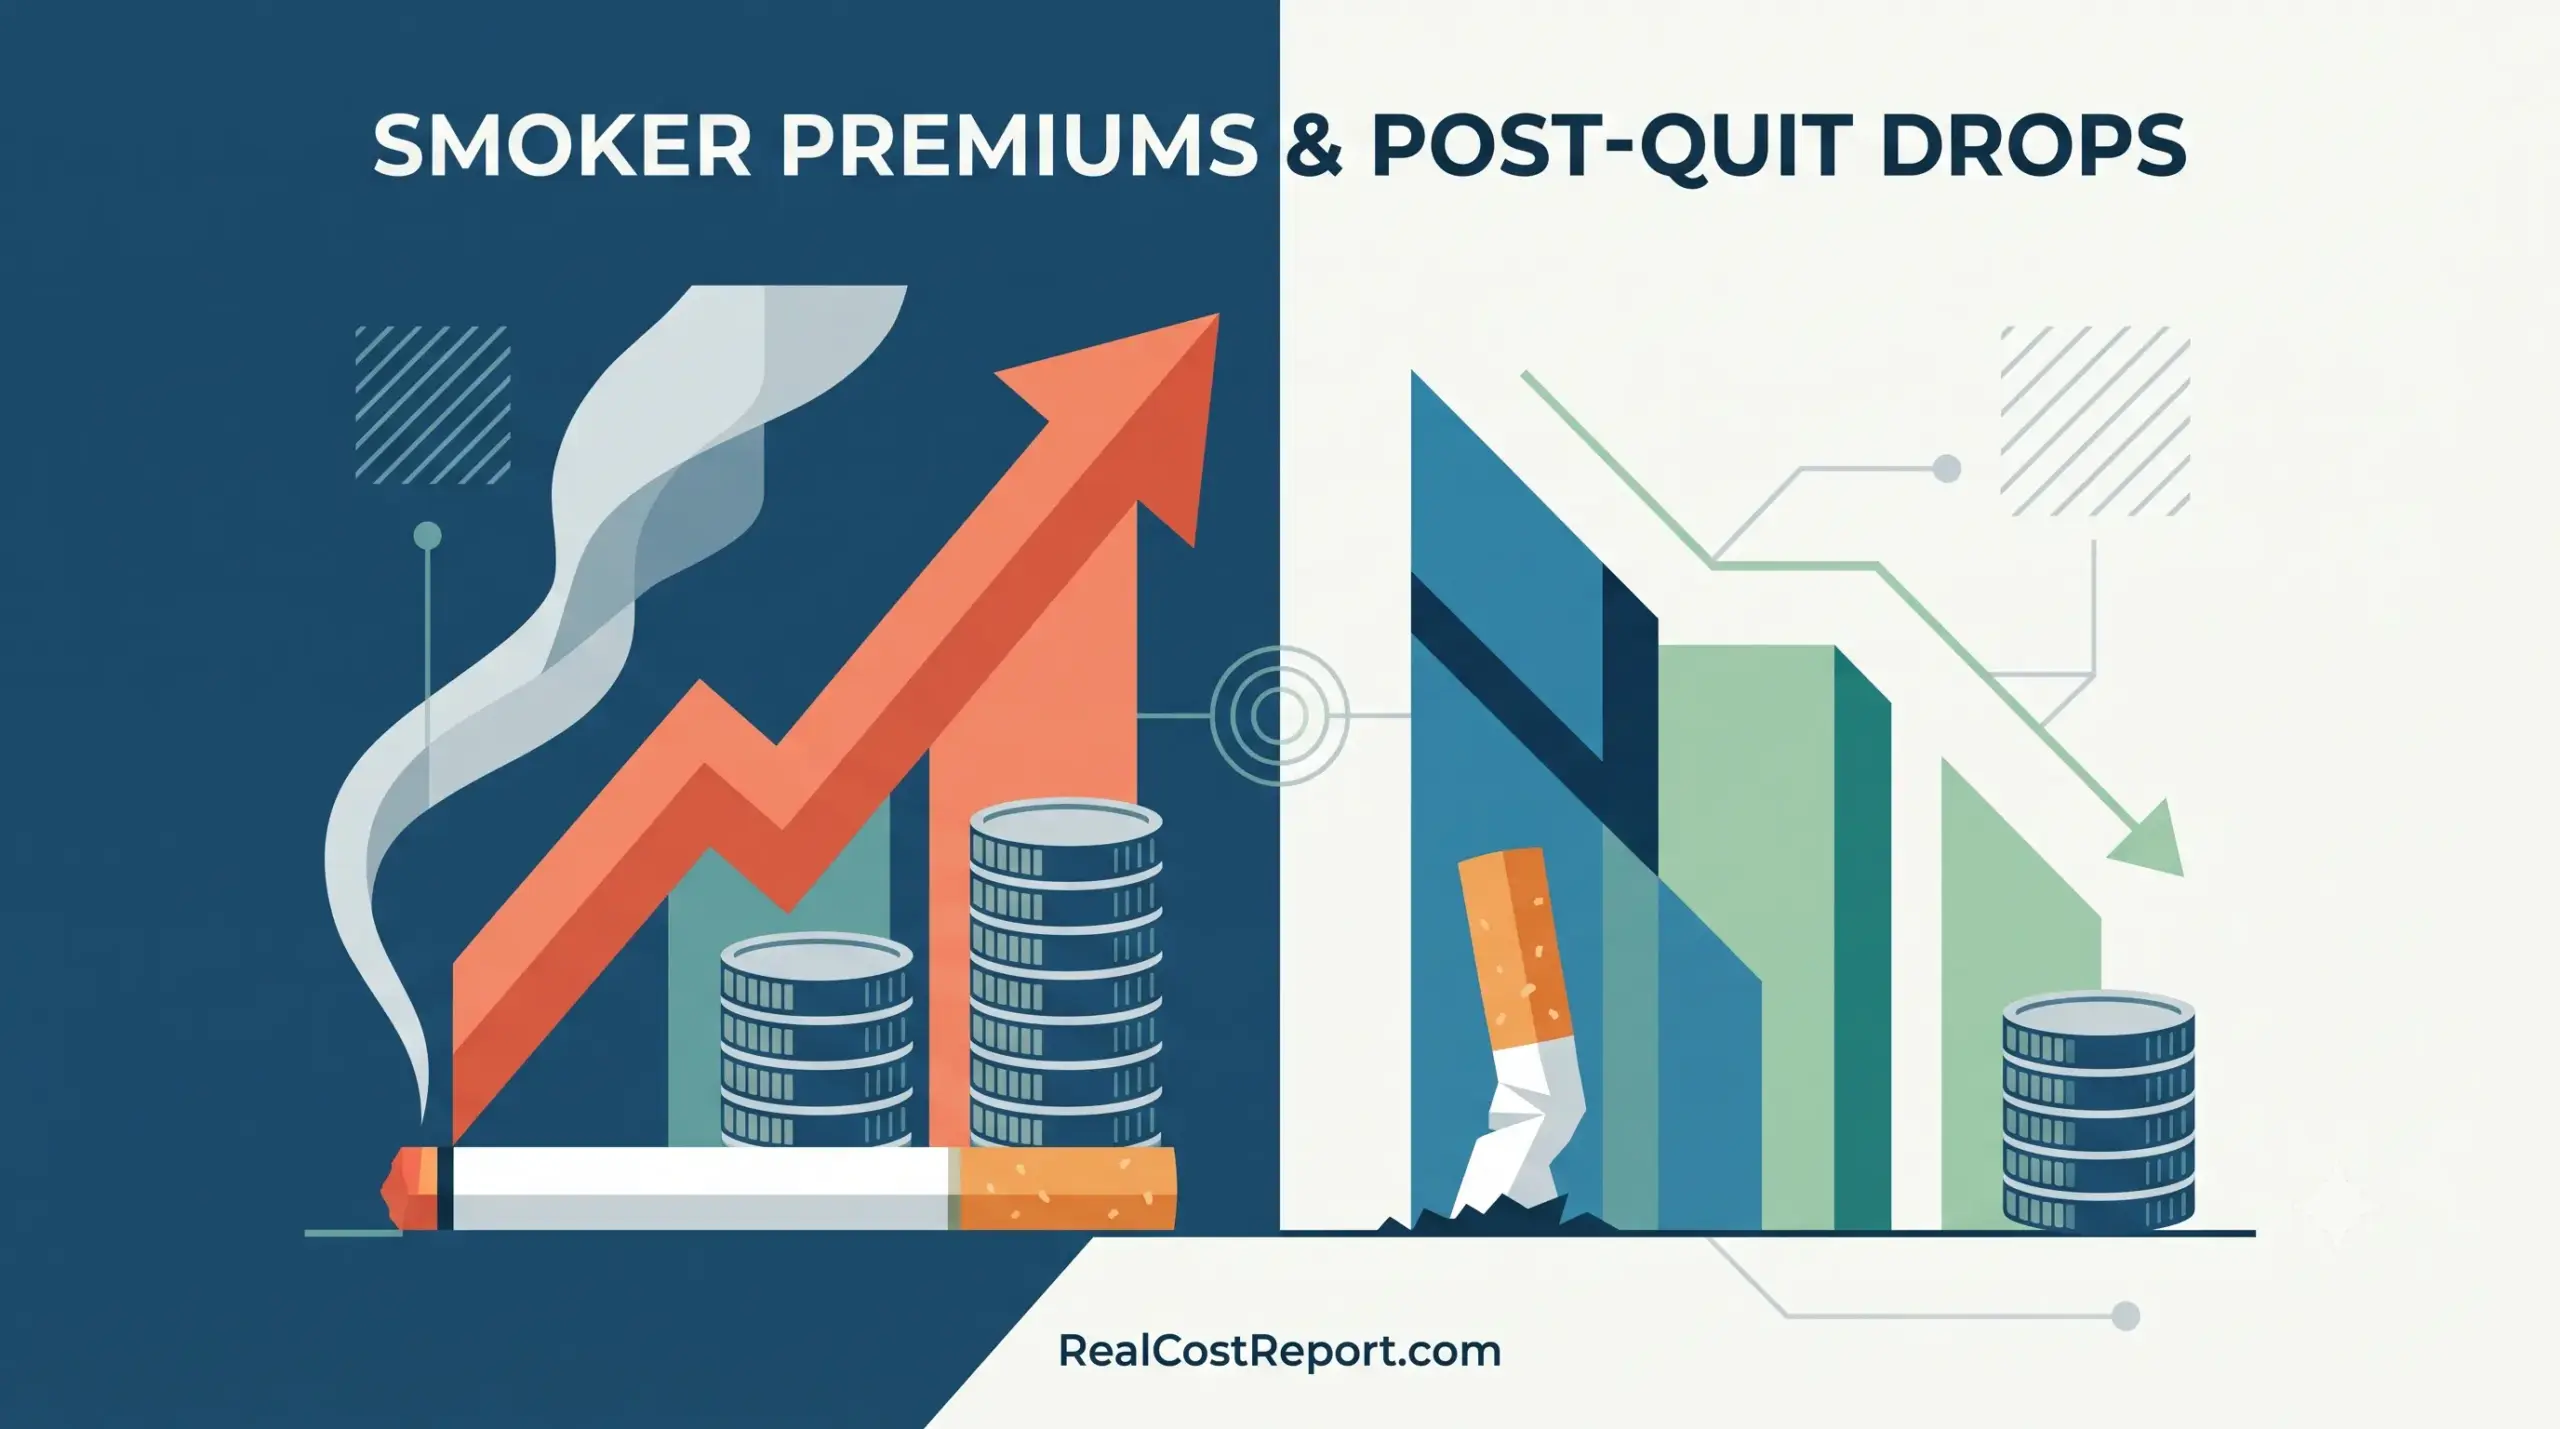
A split geometric illustration shows higher costs with an active cigarette and lower costs with a extinguished cigarette and reduced coin stacks.

Smoker Life Insurance Premiums vs Non-Smoker Rates: How Much You Save After Quitting (2026 Cost Guide)

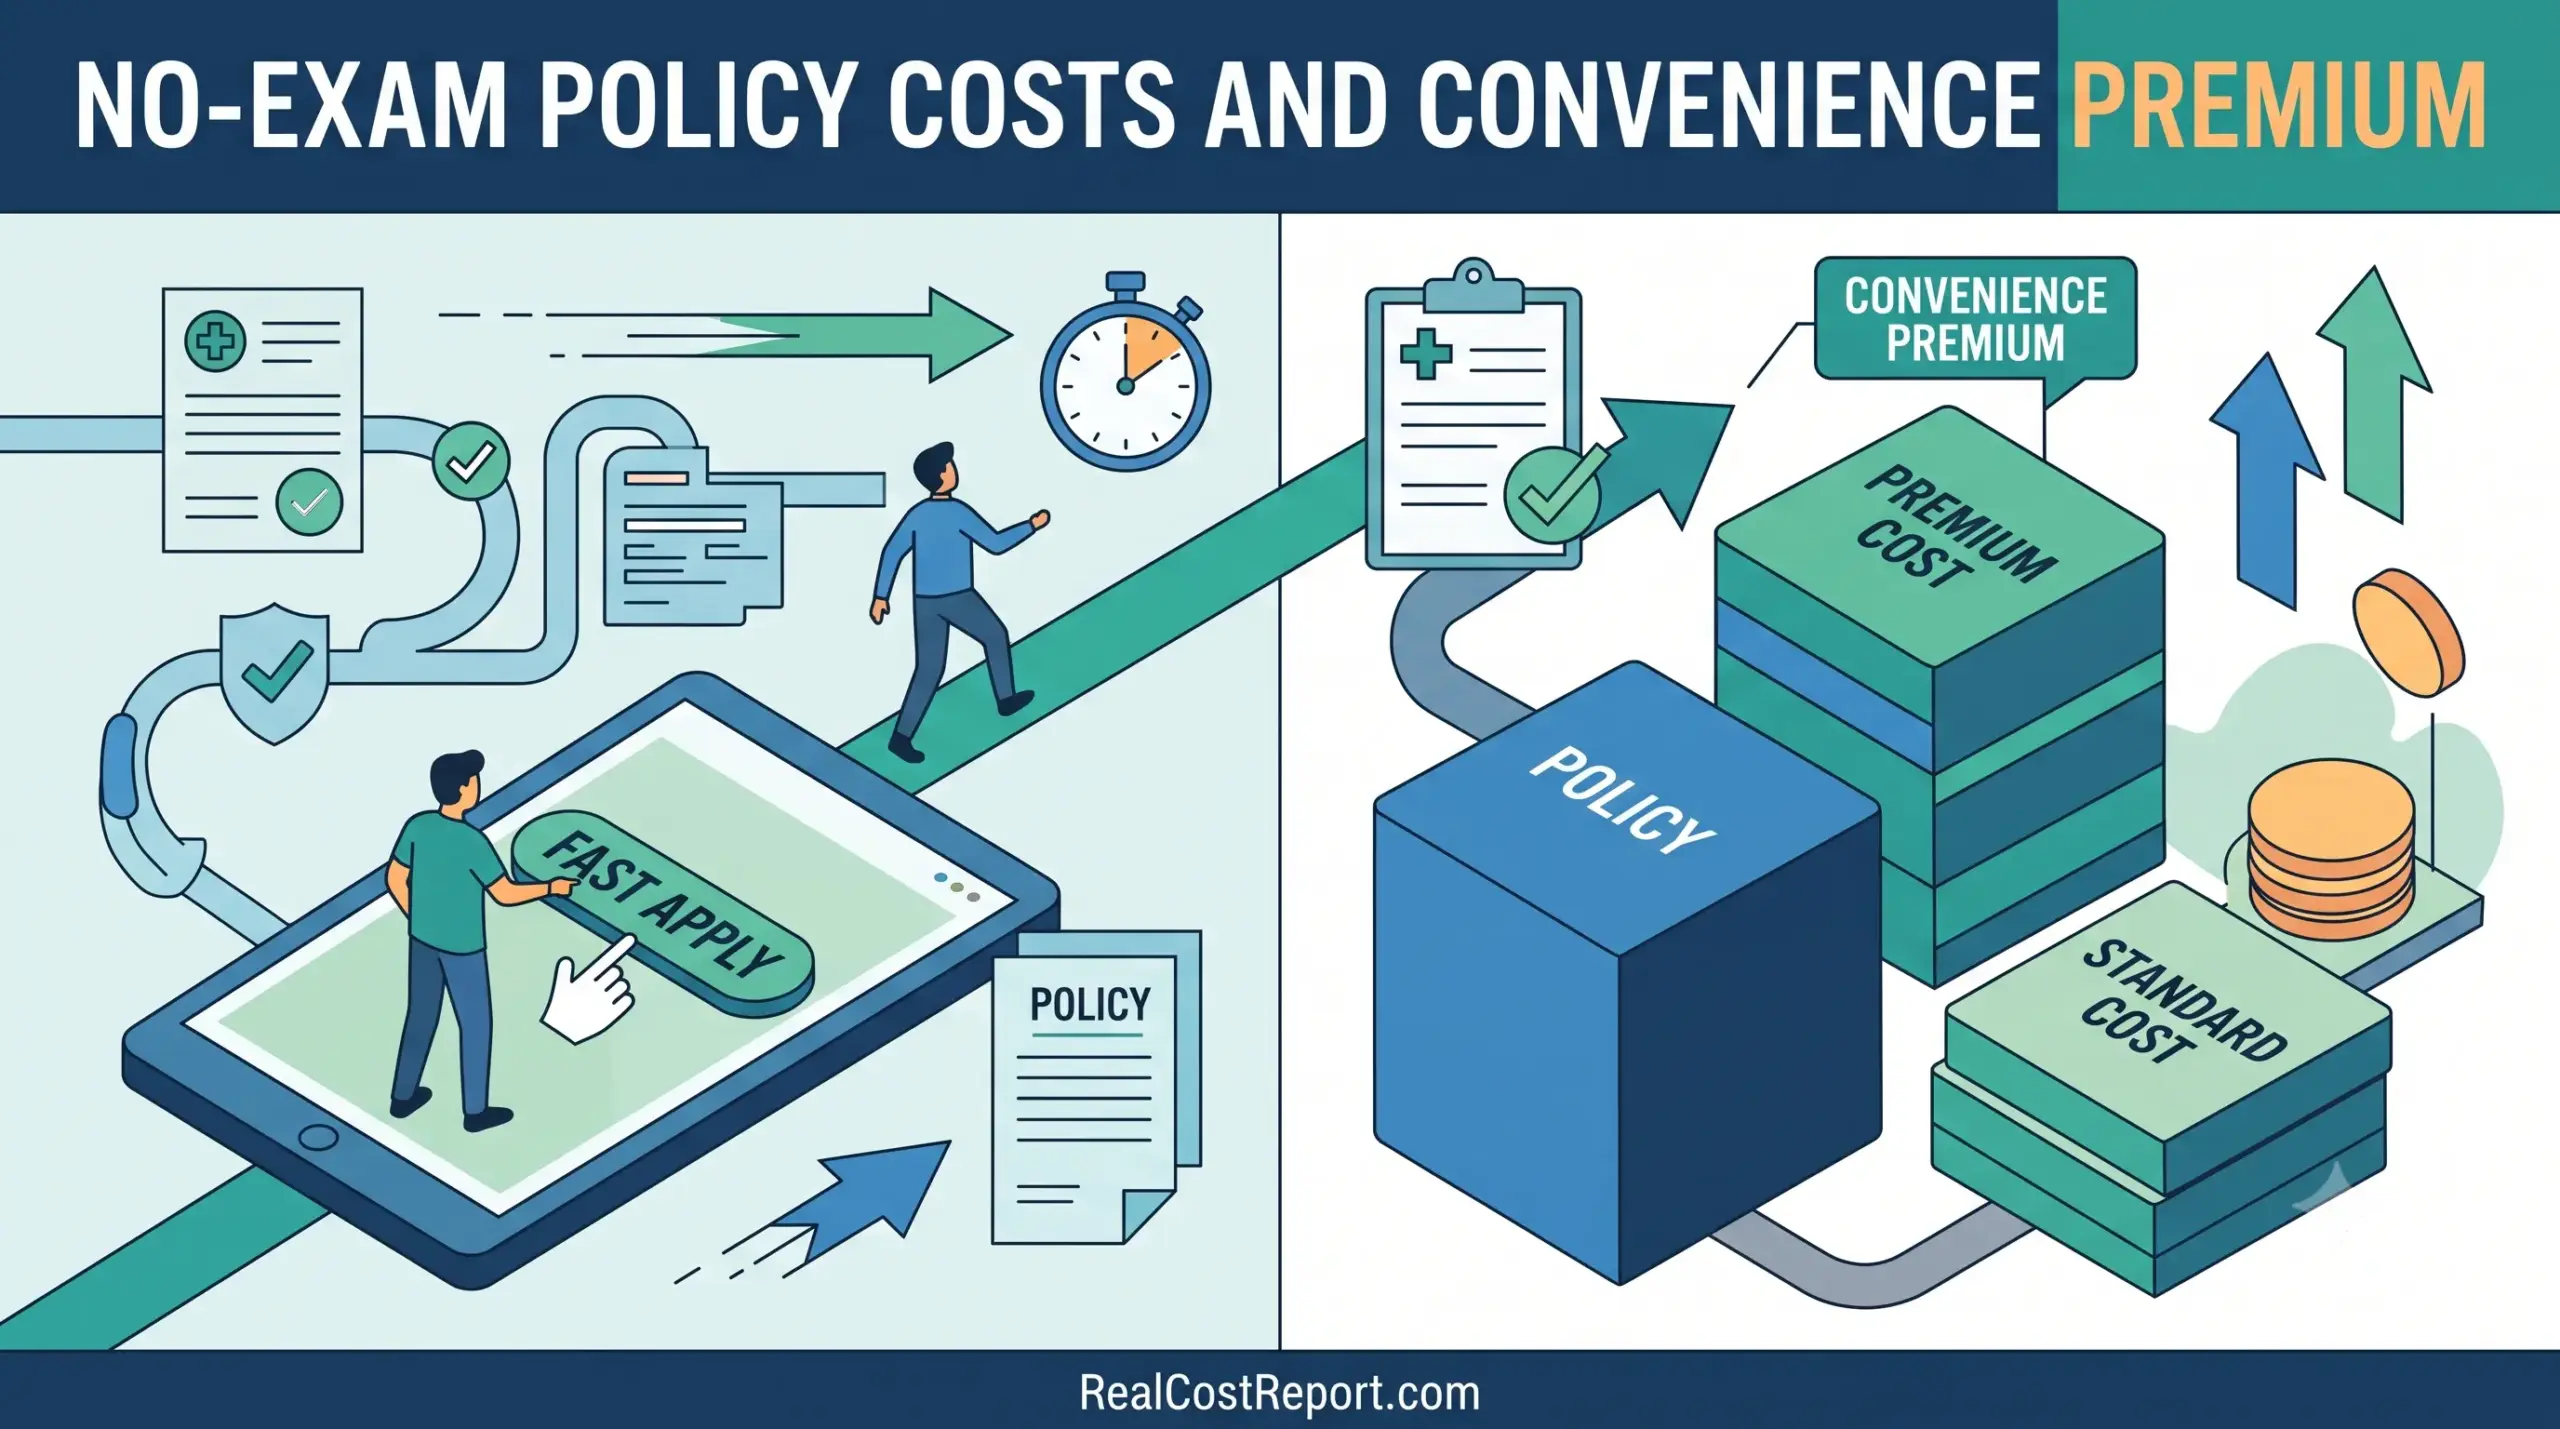
A geometric illustration for RealCostReport.com comparing the fast online application of no-exam policies with higher premium costs versus standard costs.

No-Exam Life Insurance Cost in 2026: How Much Is the Convenience Premium Really Worth?

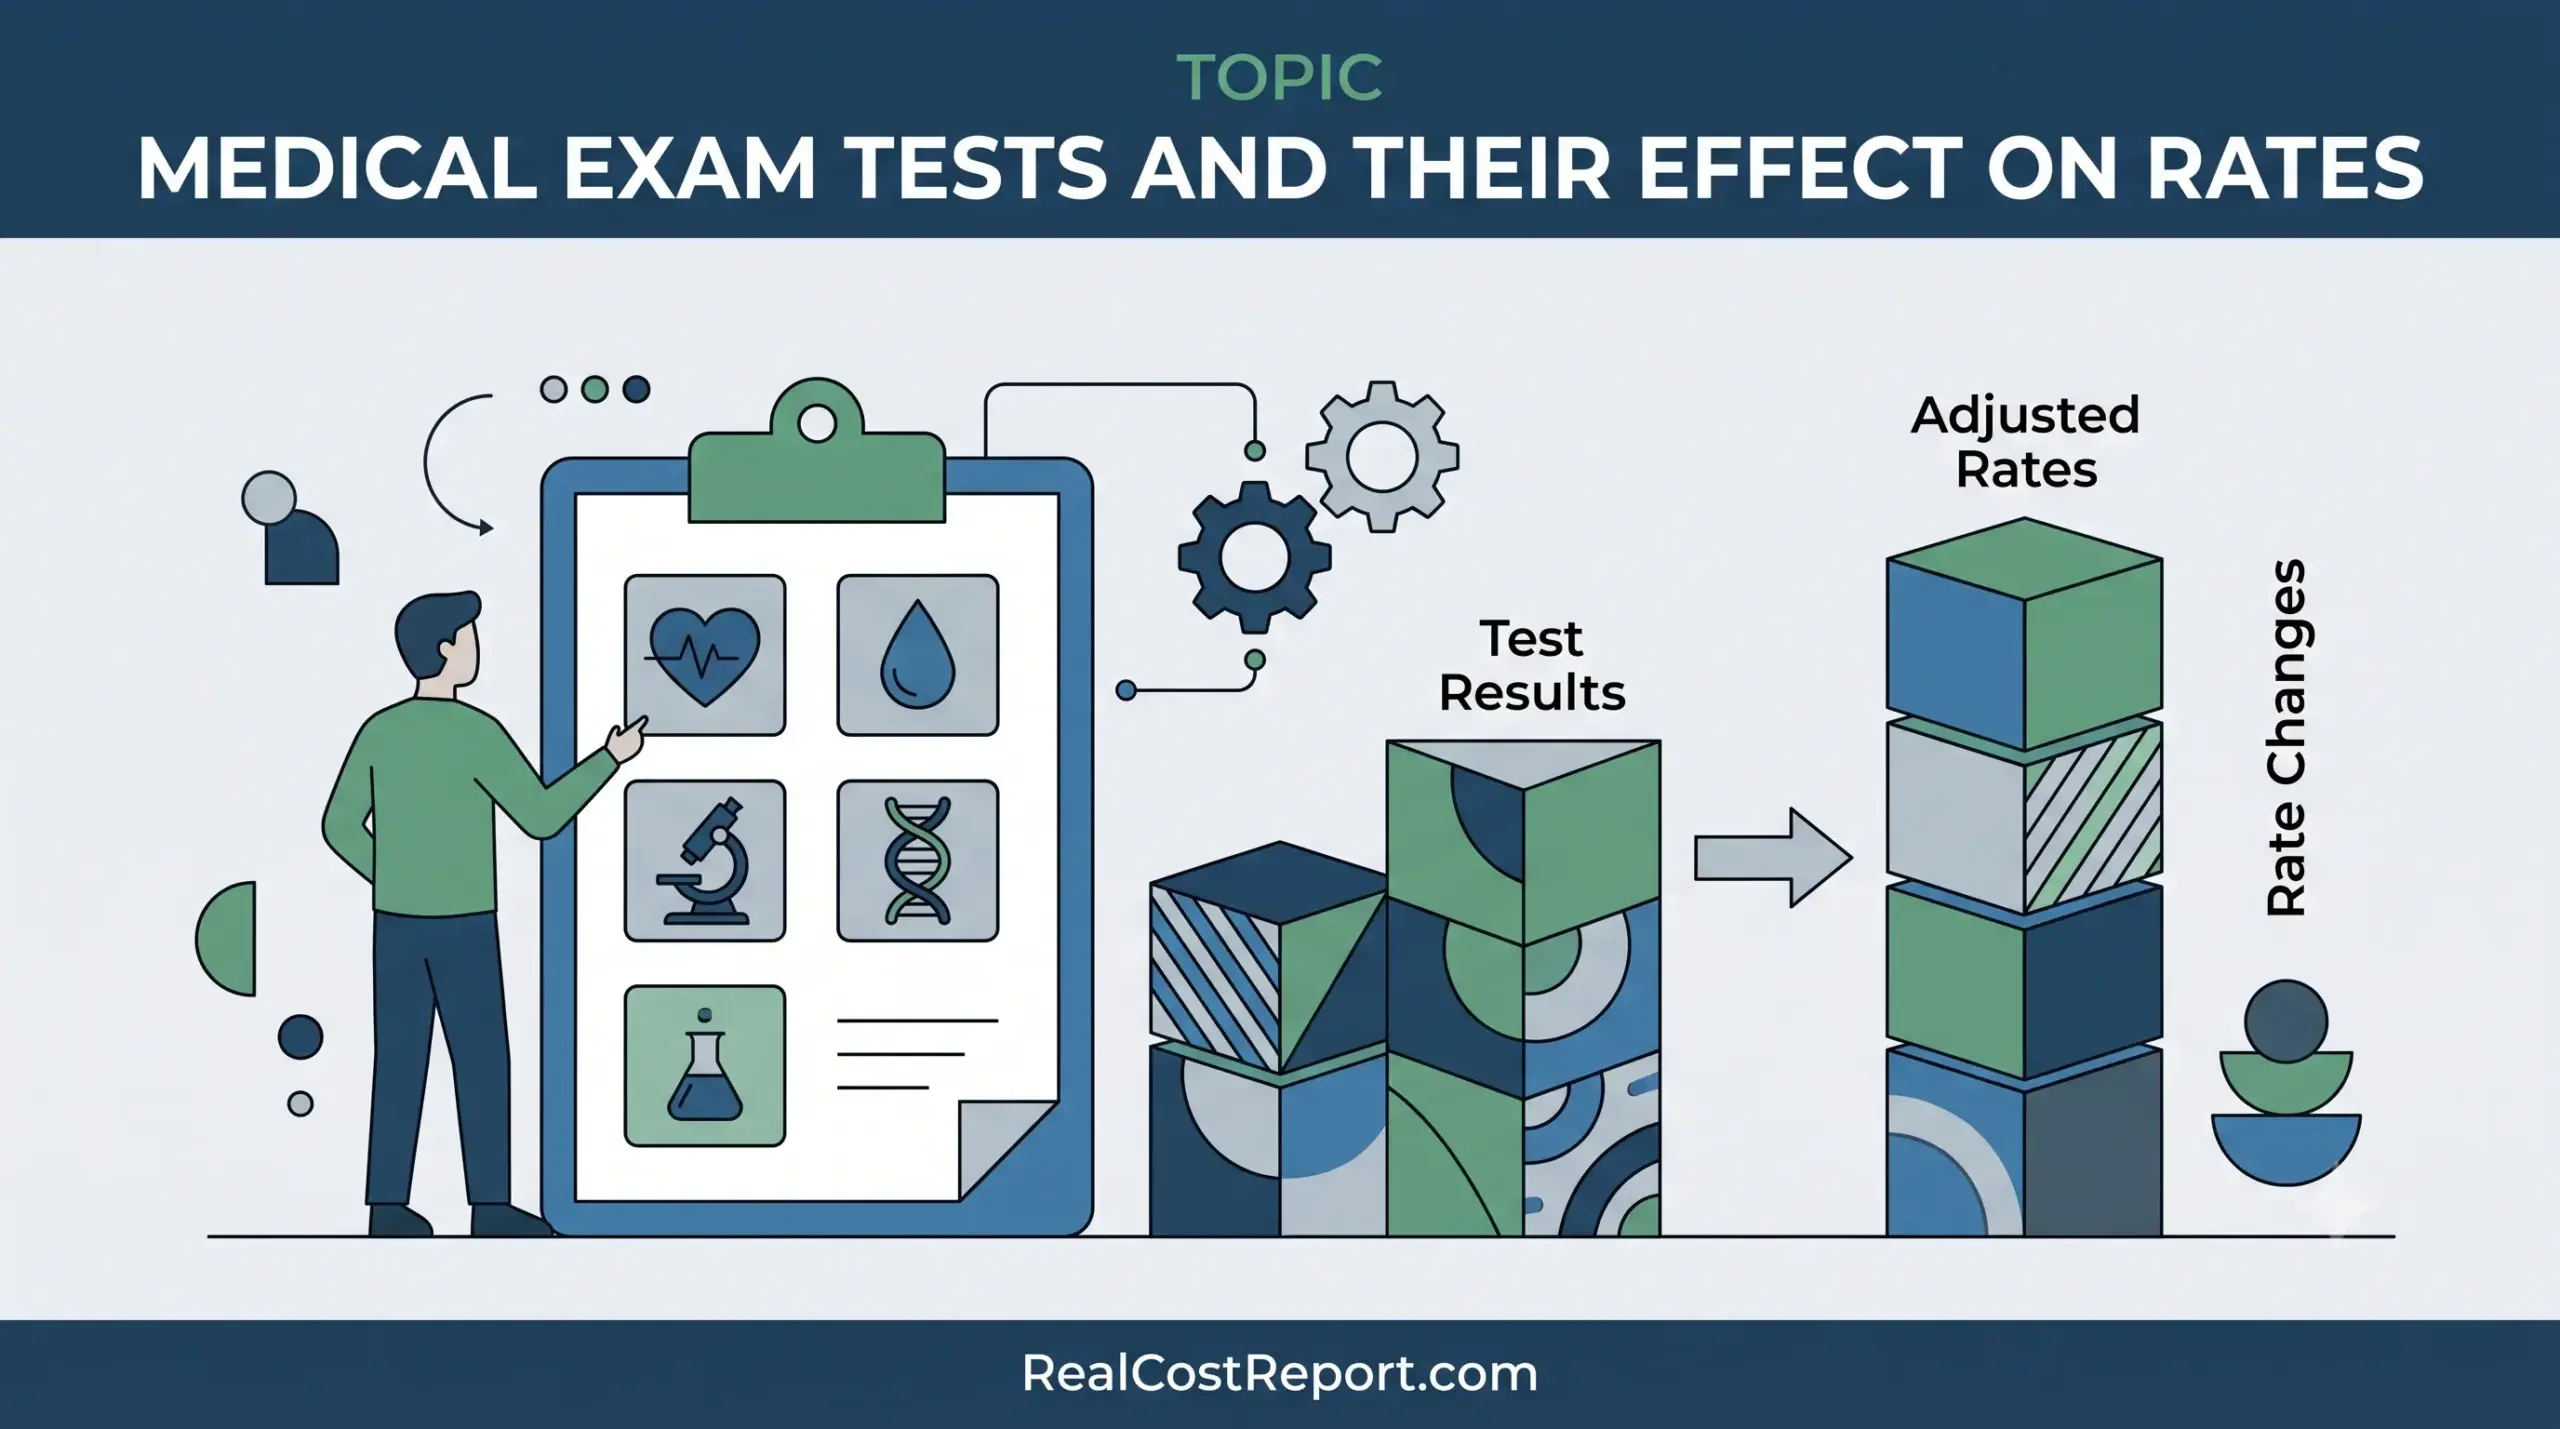
Minimalist geometric illustration showing a medical clipboard with health icons beside abstract blocks representing changing insurance rates.

Medical Exam Tests and Their Effect on Life Insurance Rates: How Much They Cost You in 2026

Geometric vector illustration visualizing rising life insurance premium data across a life timeline from youth to retirement.

Life Insurance Premium Data by Age: What $500,000 Really Costs in 2026

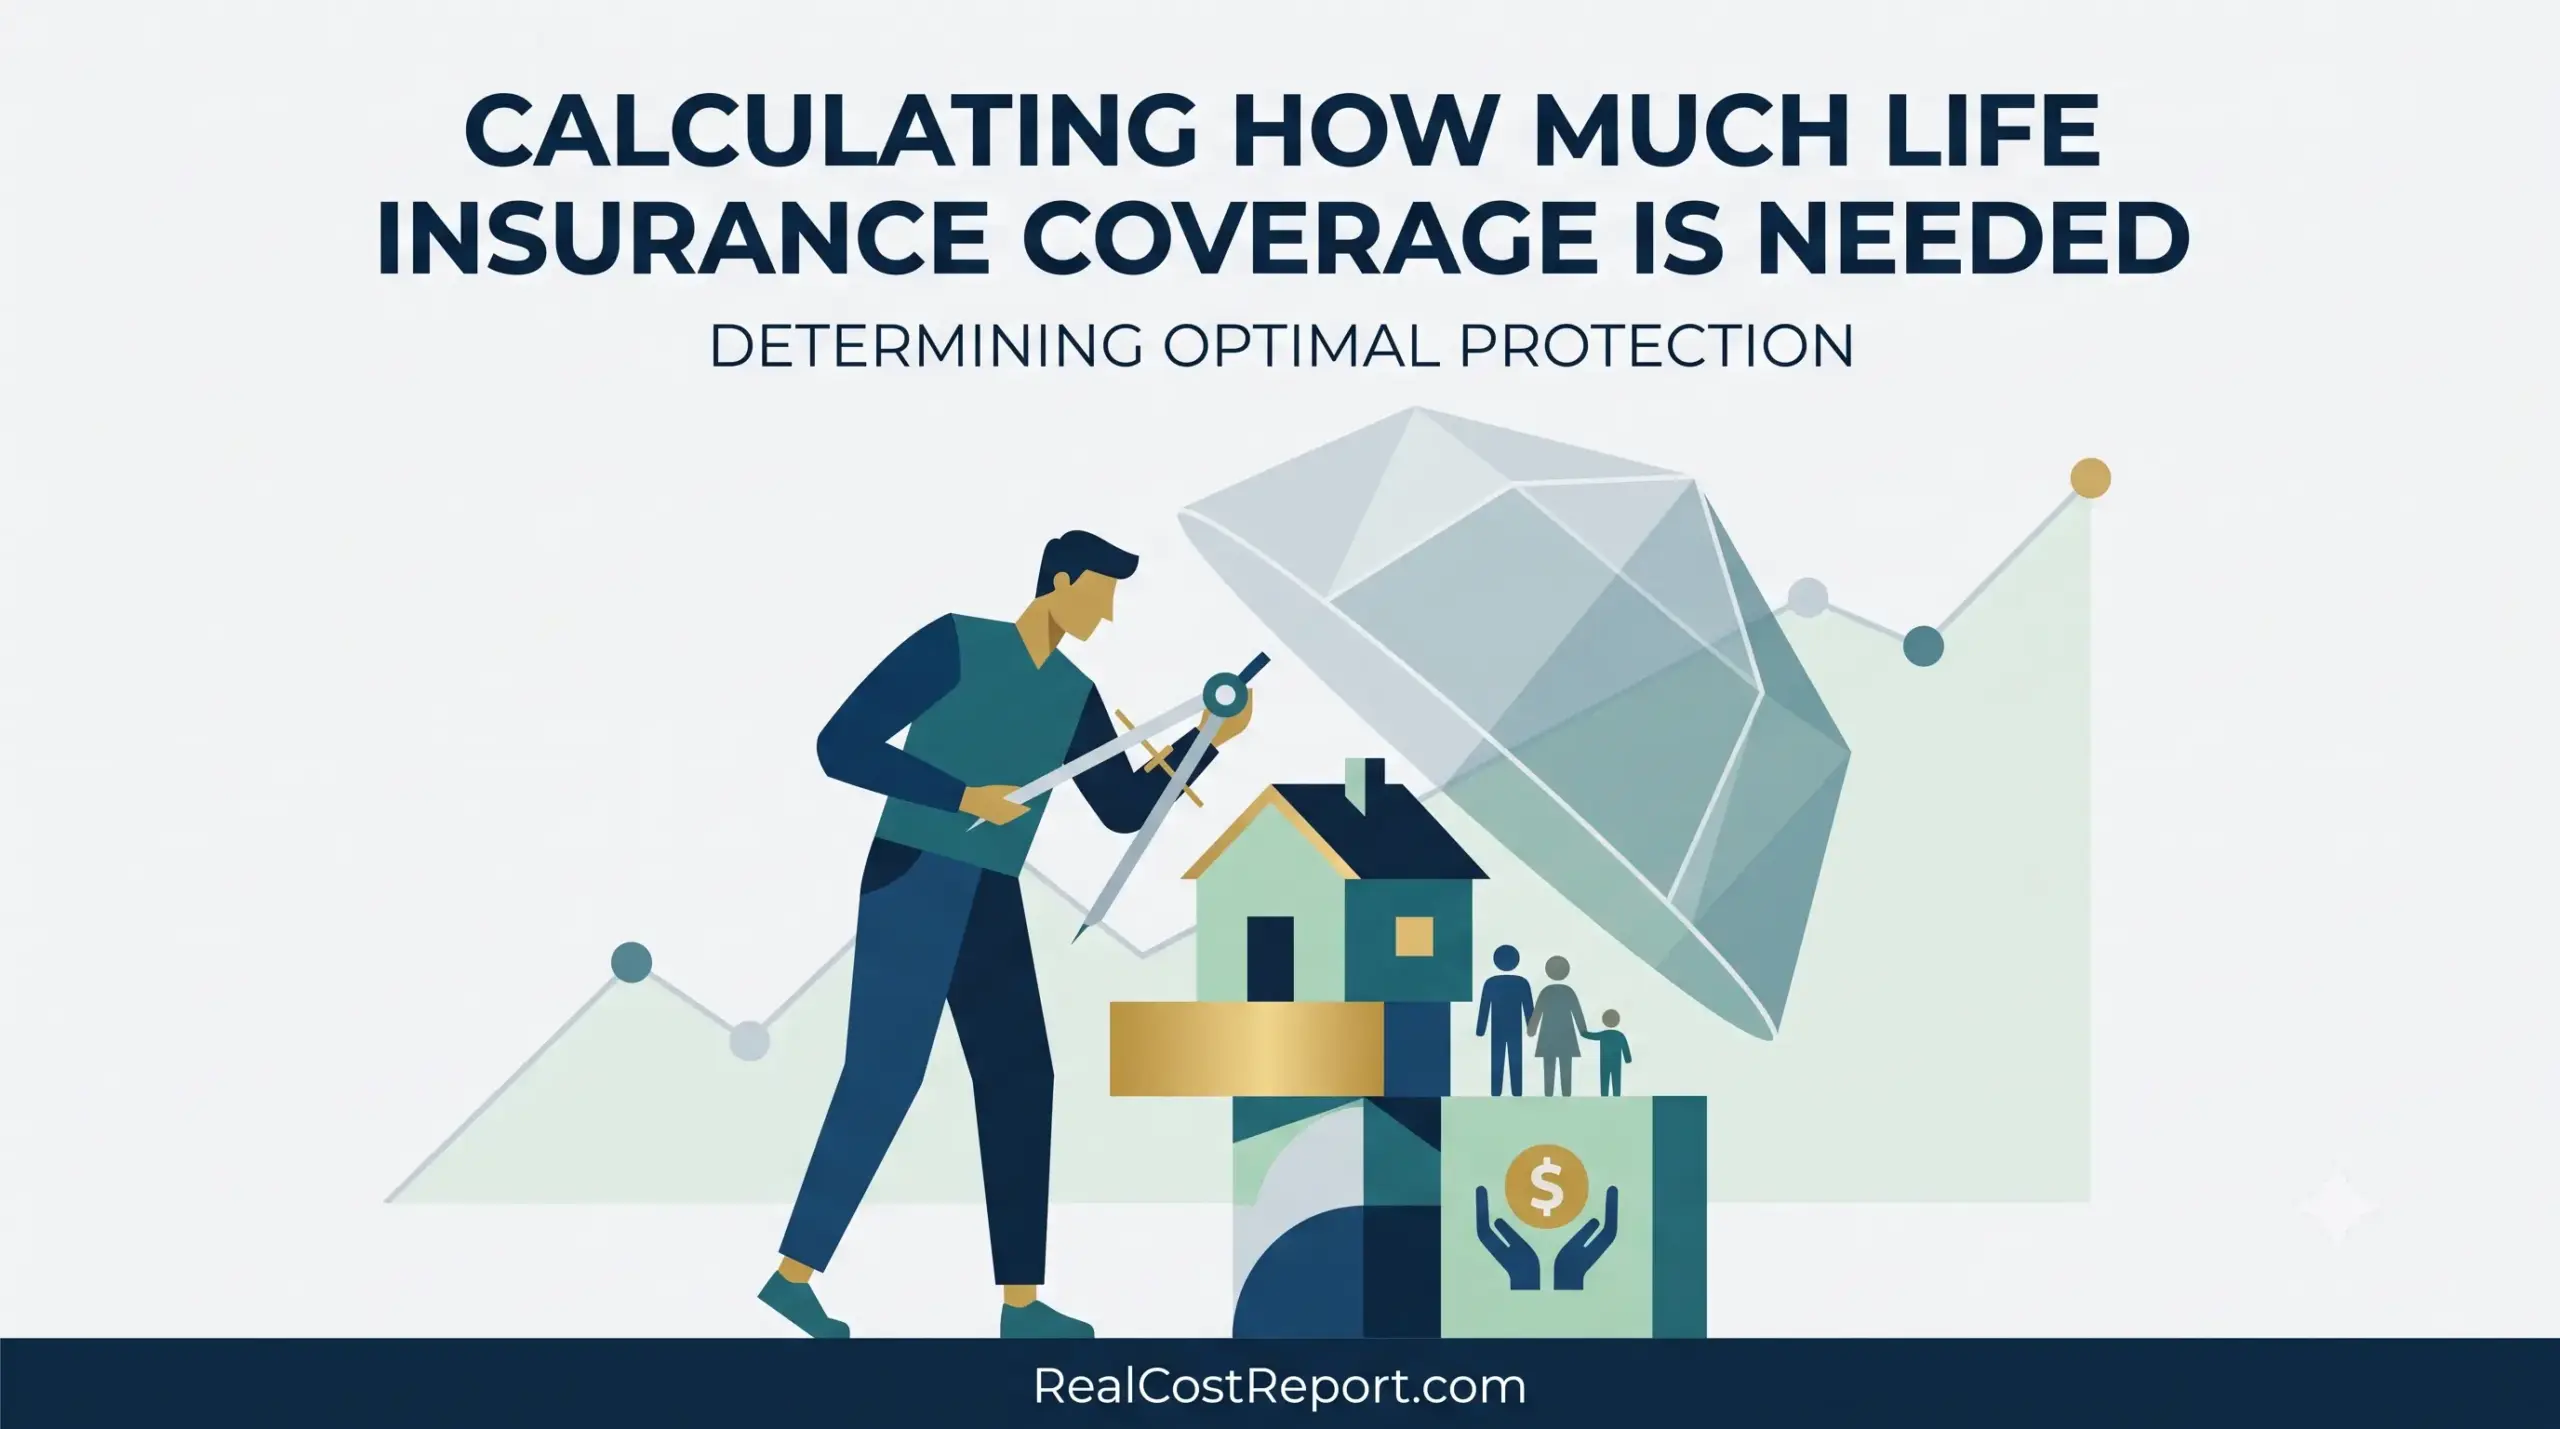
A flat design vector illustration of a man using a compass tool to calculate risk for a house and family.

How Much Life Insurance Do You Need? 2026 Coverage Calculation Guide

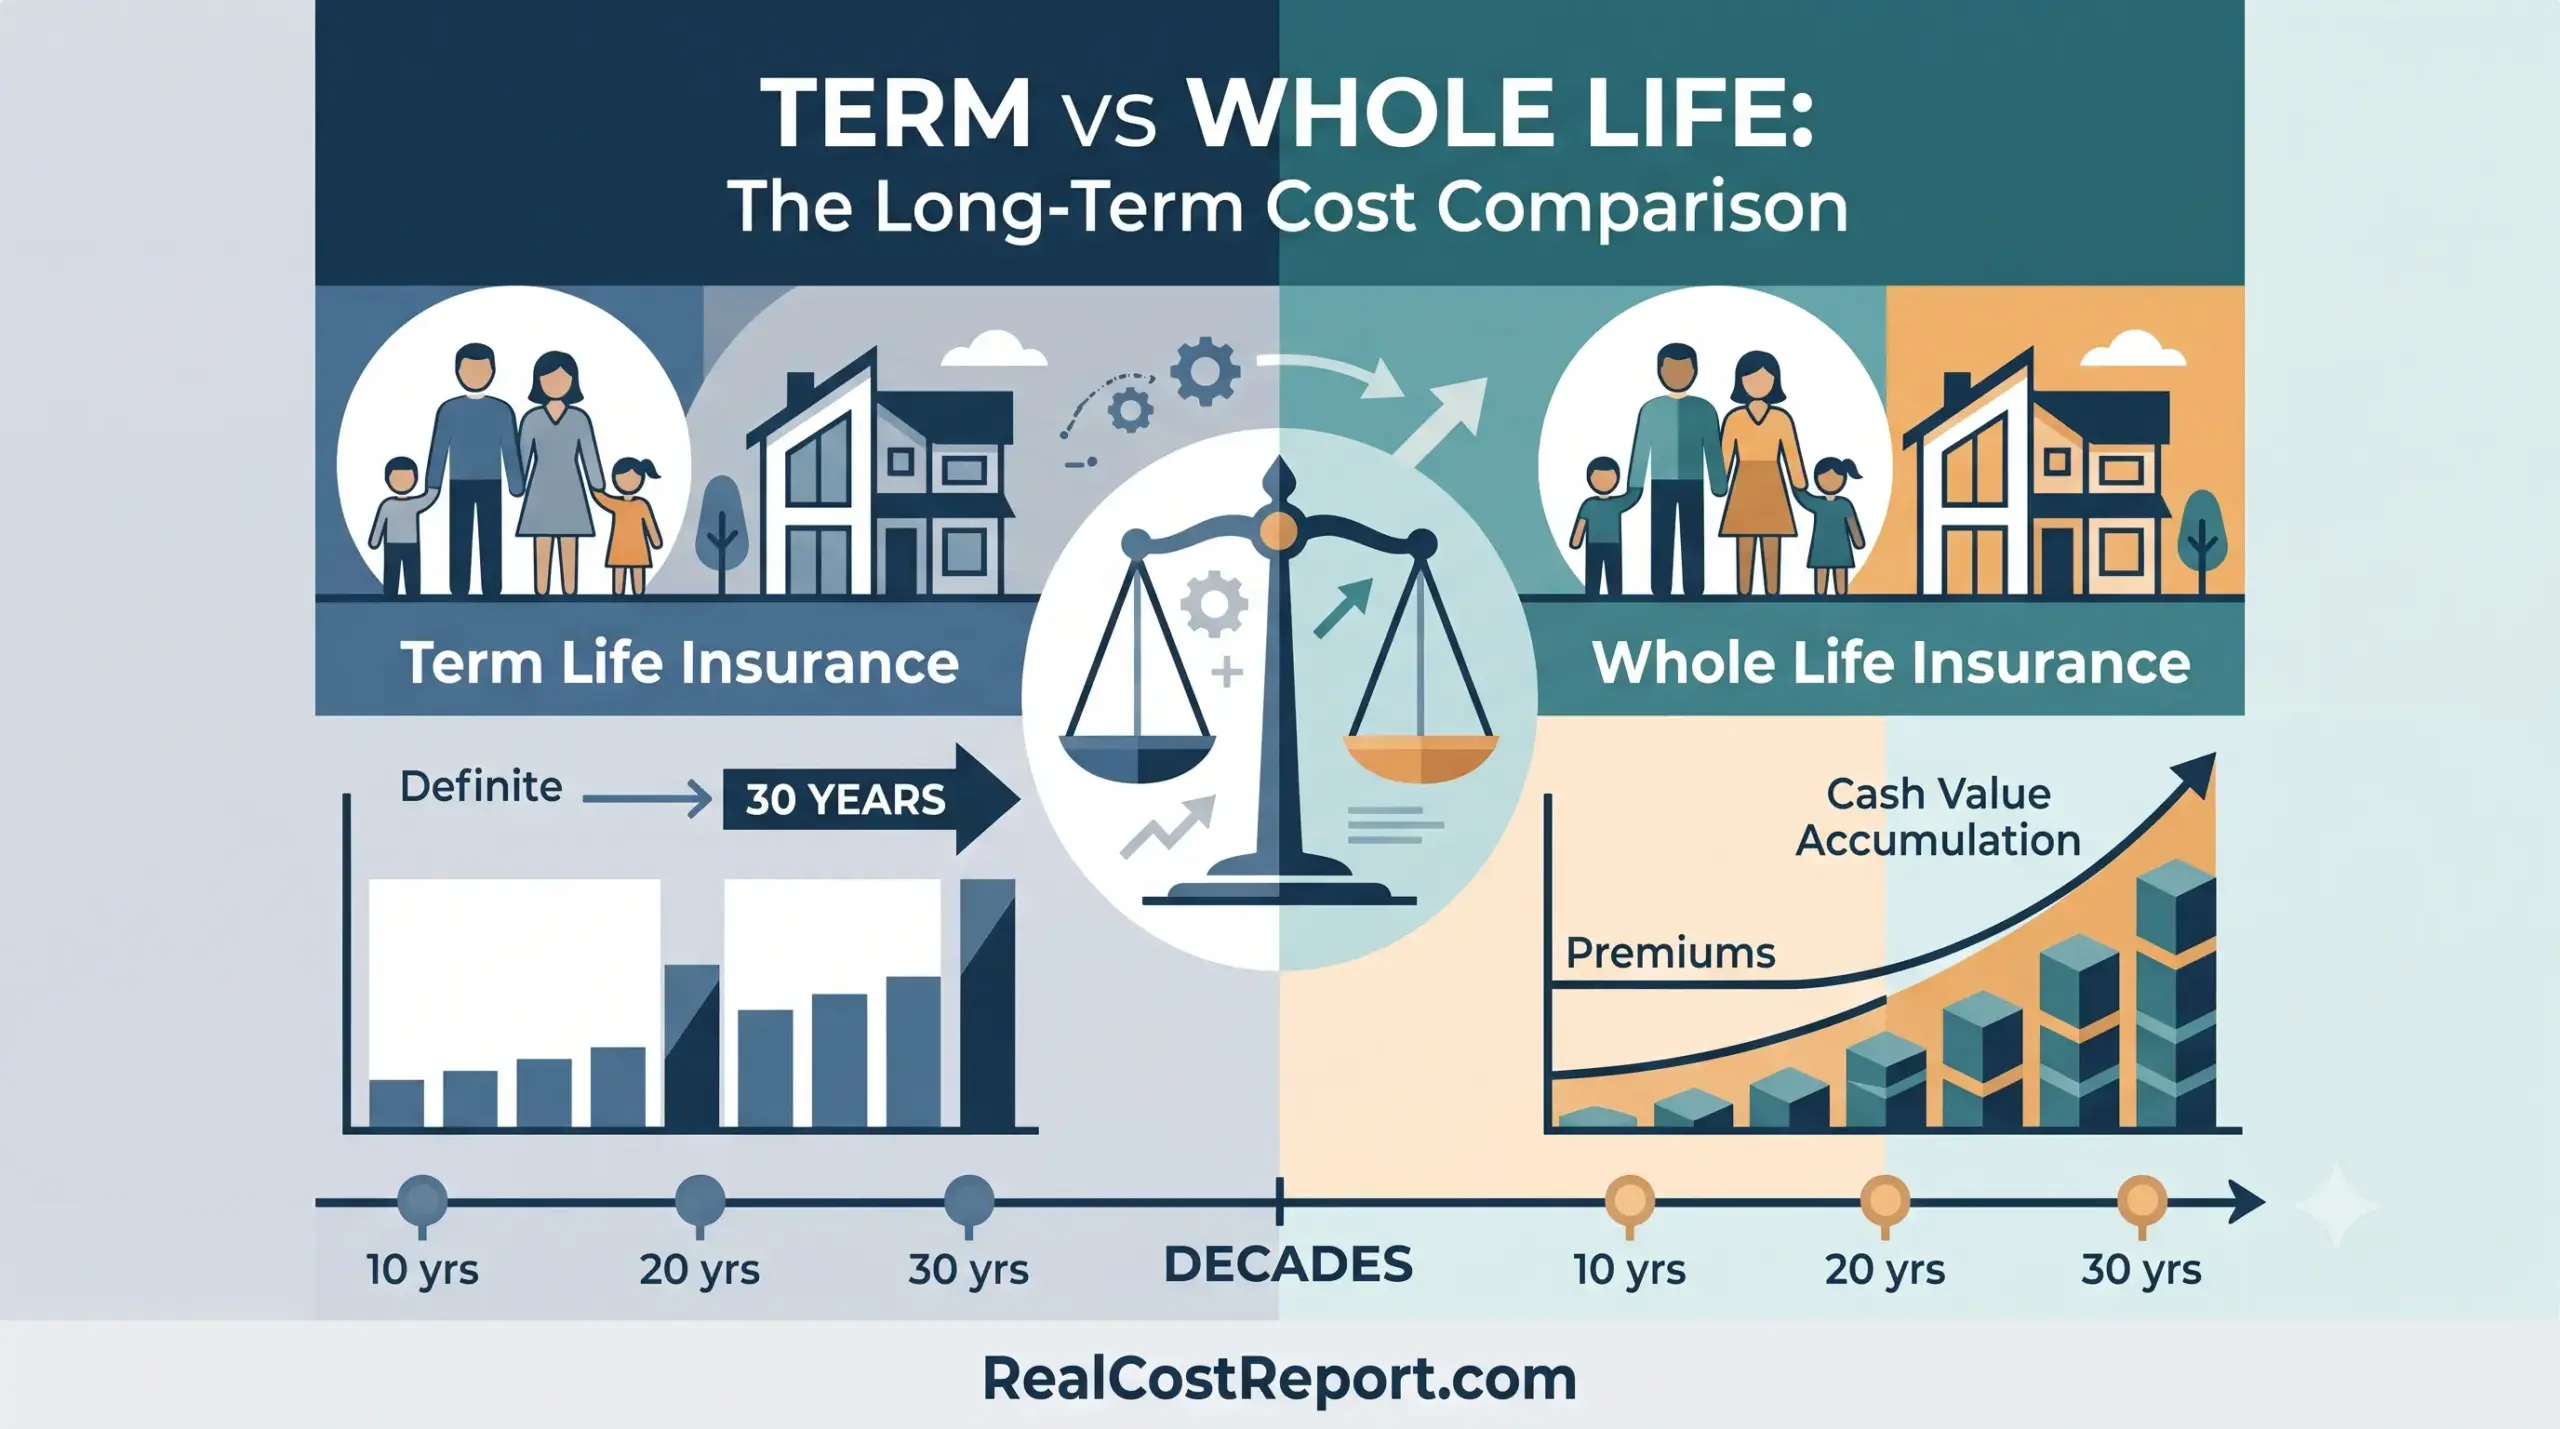
Infographic comparing term vs whole life insurance costs and features over several decades using charts and scales.

Term vs Whole Life Cost Comparison Over Decades: How Much You Really Pay in 2026

  • About Us
  • Editorial Policy
  • Methodology
  • Privacy Policy
  • Terms of Use
  • Contact Us
© 2026 Real Cost Report. All Rights Reserved.